E-Invoicing Statistics 2026: Adoption, Volumes & Country Comparisons
Explore verified e-invoicing statistics: adoption by European country and business size, invoice volumes, original sources and charts in our 2026 edition.

By Tailride · Sources checked October 22, 2026
38.68% of EU enterprises with at least 10 persons employed sent structured e-invoices in the latest comparable Eurostat observation available for this article. The dataset labels that observation 2023; the survey asked about invoicing during 2022. Italy recorded 97.46%, Spain 39.97% and Germany 24.41%. These are shares of enterprises, not shares of all invoices. Eurostat; survey questionnaire
More recent operational reports show the scale of individual invoice flows: France's Chorus Pro received more than 84 million invoices in 2025, while Spain's FACe recorded 19,471,635 submissions. Those platform counts answer a different question from the enterprise adoption survey. AIFE; FACe dashboard
This 2026 edition brings the two types of evidence together, keeping their periods, definitions and coverage separate. The country comparison covers Germany, France, Spain, Portugal, the Netherlands and Italy, alongside the EU-27 aggregate. It does not provide a US adoption estimate or a worldwide census.
Key e-invoicing statistics
-
38.68%: EU-27 enterprises sending structured e-invoices, 2023 survey covering 2022. Eurostat
-
37.01% versus 59.91%: EU adoption among enterprises with 10–49 versus 250+ persons employed in that same observation. Eurostat
-
More than 84 million: invoices received by Chorus Pro in 2025, within its public-sector platform scope. AIFE
-
19,471,635: invoices submitted to FACe in Spain in 2025, including its repository. FACe
-
1,574,088: supplier invoicing documents sent to Portugal's FE-AP in 2025. The source counts documents, rather than defining a national invoice total. eSPap, p. 59
E-invoicing adoption by country
| Country / area | Enterprises sending structured e-invoices |
|---|---|
| Italy | 97.46% |
| Spain | 39.97% |
| EU-27 | 38.68% |
| Netherlands | 37.38% |
| France | 30.65% (b) |
| Portugal | 24.52% |
| Germany | 24.41% |
Source: Eurostat, isoc_eb_ics, E_INV4S_AP. Unit: percentage of enterprises; size: 10+ persons employed; covered business activities excluding the financial sector. Survey year 2023, invoicing reference year 2022. (b) marks a break in France's time series. The EU figure is Eurostat's published aggregate, not an average calculated from the six countries shown here.
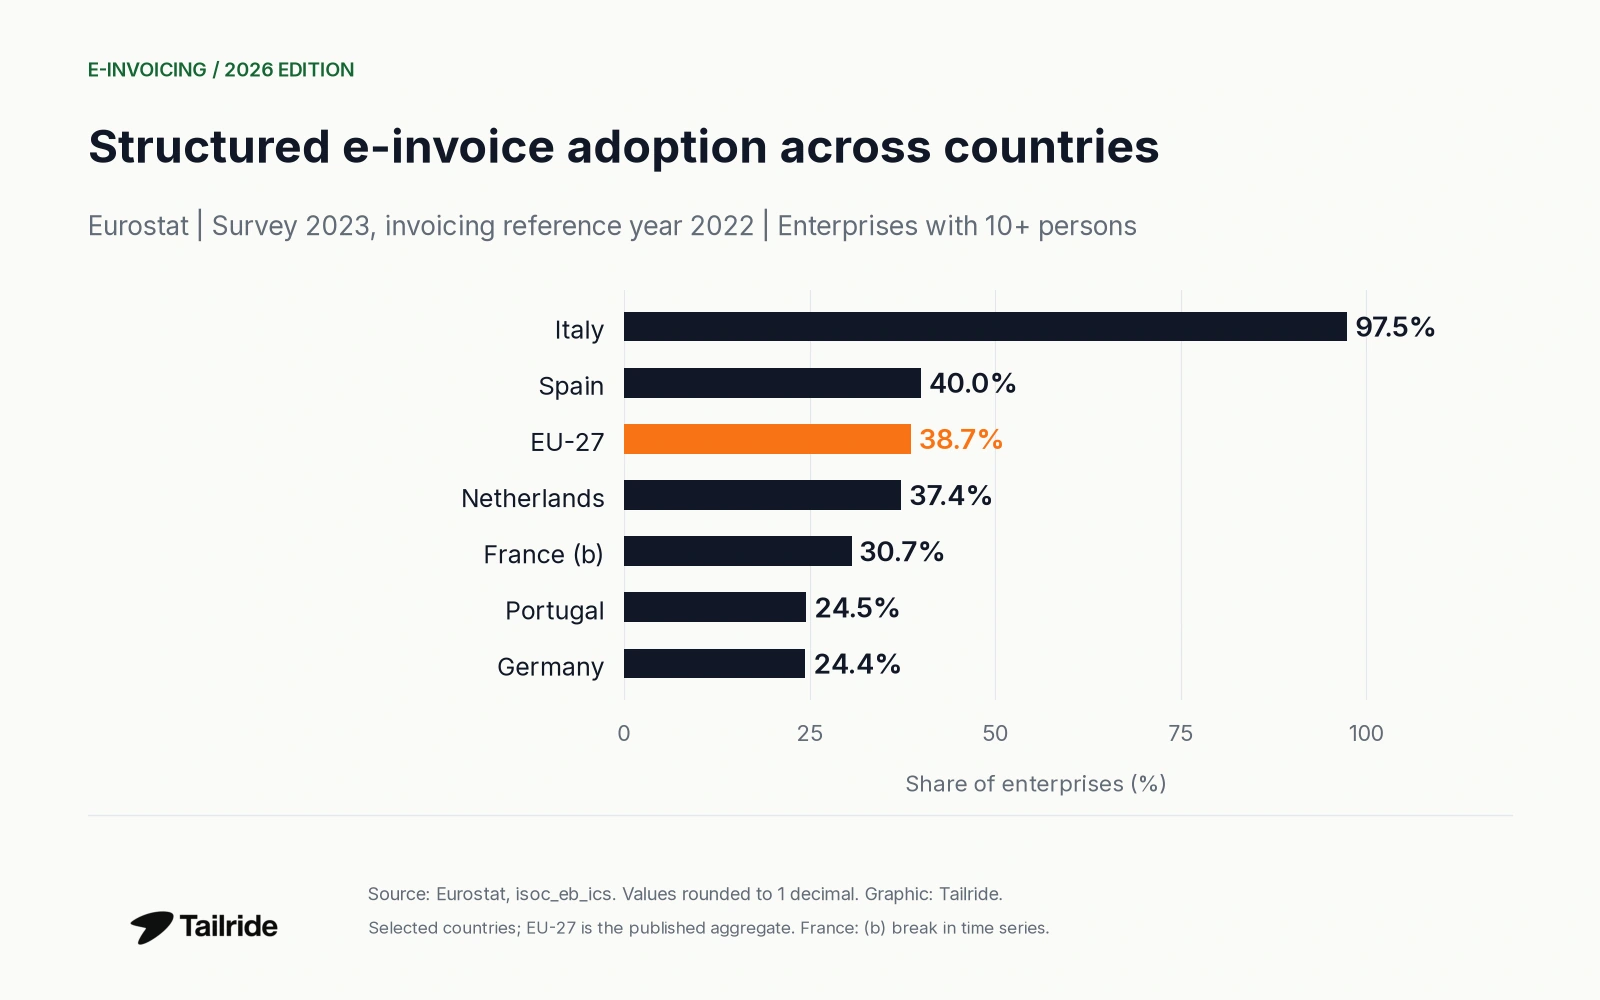
Figure 1. Selected-country adoption under the same indicator and survey wave. Values describe whether enterprises sent structured invoices, not how many they sent.
Italy's 97.46% is 58.78 percentage points above the EU aggregate. That difference is calculated from the published values. It does not measure a productivity advantage, the percentage of invoice value digitized, or the quality of accounting records. Spain is slightly above the aggregate; the Netherlands, France, Portugal and Germany are below it in this historical observation.
The date matters. A country can expand e-invoicing substantially after the reference year. A historical survey should not be relabelled a 2026 adoption rate simply because it appears in an article published in 2026. France's break flag is another reason not to connect survey waves into an uninterrupted growth curve.
E-invoicing adoption by business size
The EU figures show a size gap within the covered population. Enterprises with 250+ persons employed were more likely to send structured invoices than those with 10–49 persons employed. “Persons employed” is the survey's size measure; it should not be replaced with a count of software users or invoice-processing staff.
| Persons employed | EU-27 adoption |
|---|---|
| 10-49 | 37.01% |
| 50-249 | 44.04% |
| 250+ | 59.91% |
Source: Eurostat, 2023 survey covering invoicing in 2022. The English overview shows the EU-27 benchmark; country editions examine their corresponding national size classes.
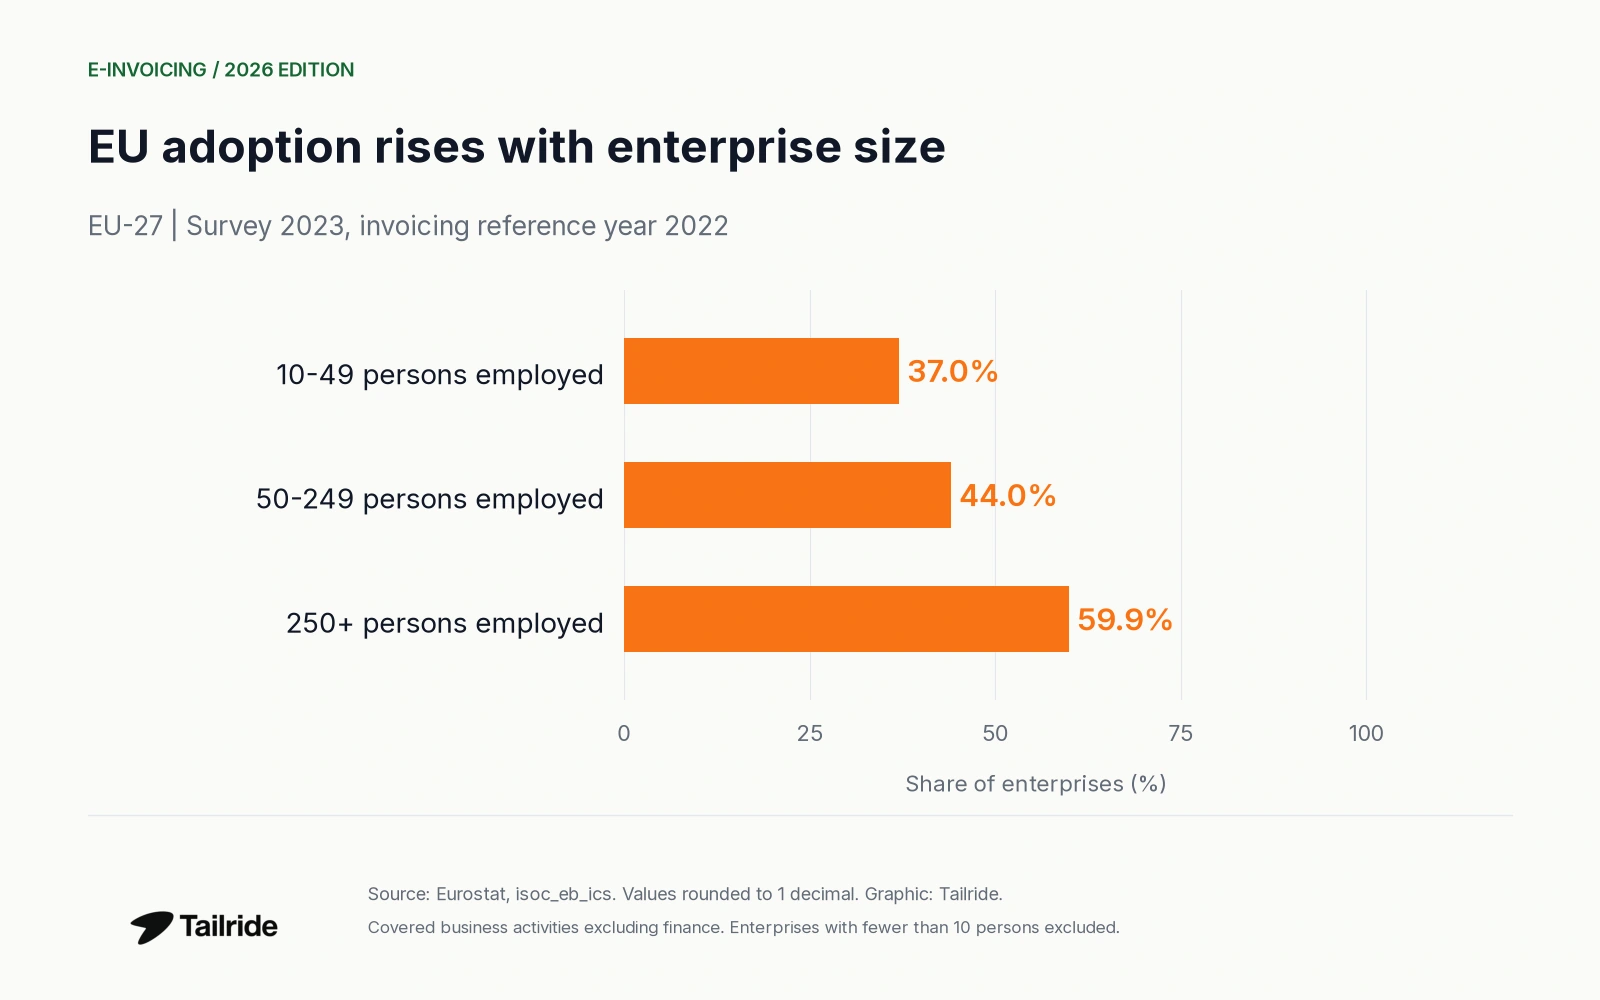
Figure 2. EU-27 structured e-invoice adoption by enterprise size. The 10–49 and 250+ groups differ by 22.90 percentage points.
These size classes exclude enterprises with fewer than 10 persons employed from the comparison. They therefore cannot describe every sole trader or microbusiness. The overall EU rate is also not the simple mean of the three class percentages: the underlying enterprise populations have different weights.
Structured invoices, PDFs and paper coexist
Eurostat distinguishes structured invoices suitable for automated processing from unstructured electronic invoices and paper invoices. Its questionnaire places ordinary emailed PDF or image invoices in the unstructured category. A document containing structured invoice data needs to be assessed on that data, rather than its visible appearance alone. Eurostat methodology, printed p. 59
| Invoice type sent | EU-27 share |
|---|---|
| Structured e-invoices | 38.68% |
| Unstructured electronic invoices | 72.84% |
| Paper invoices | 70.24% |
Source: Eurostat, same 2023 survey and 2022 reference period. Categories overlap: an enterprise may send all three types. These are enterprise participation rates, not a distribution of invoice volumes, so they must not be added to 100%.
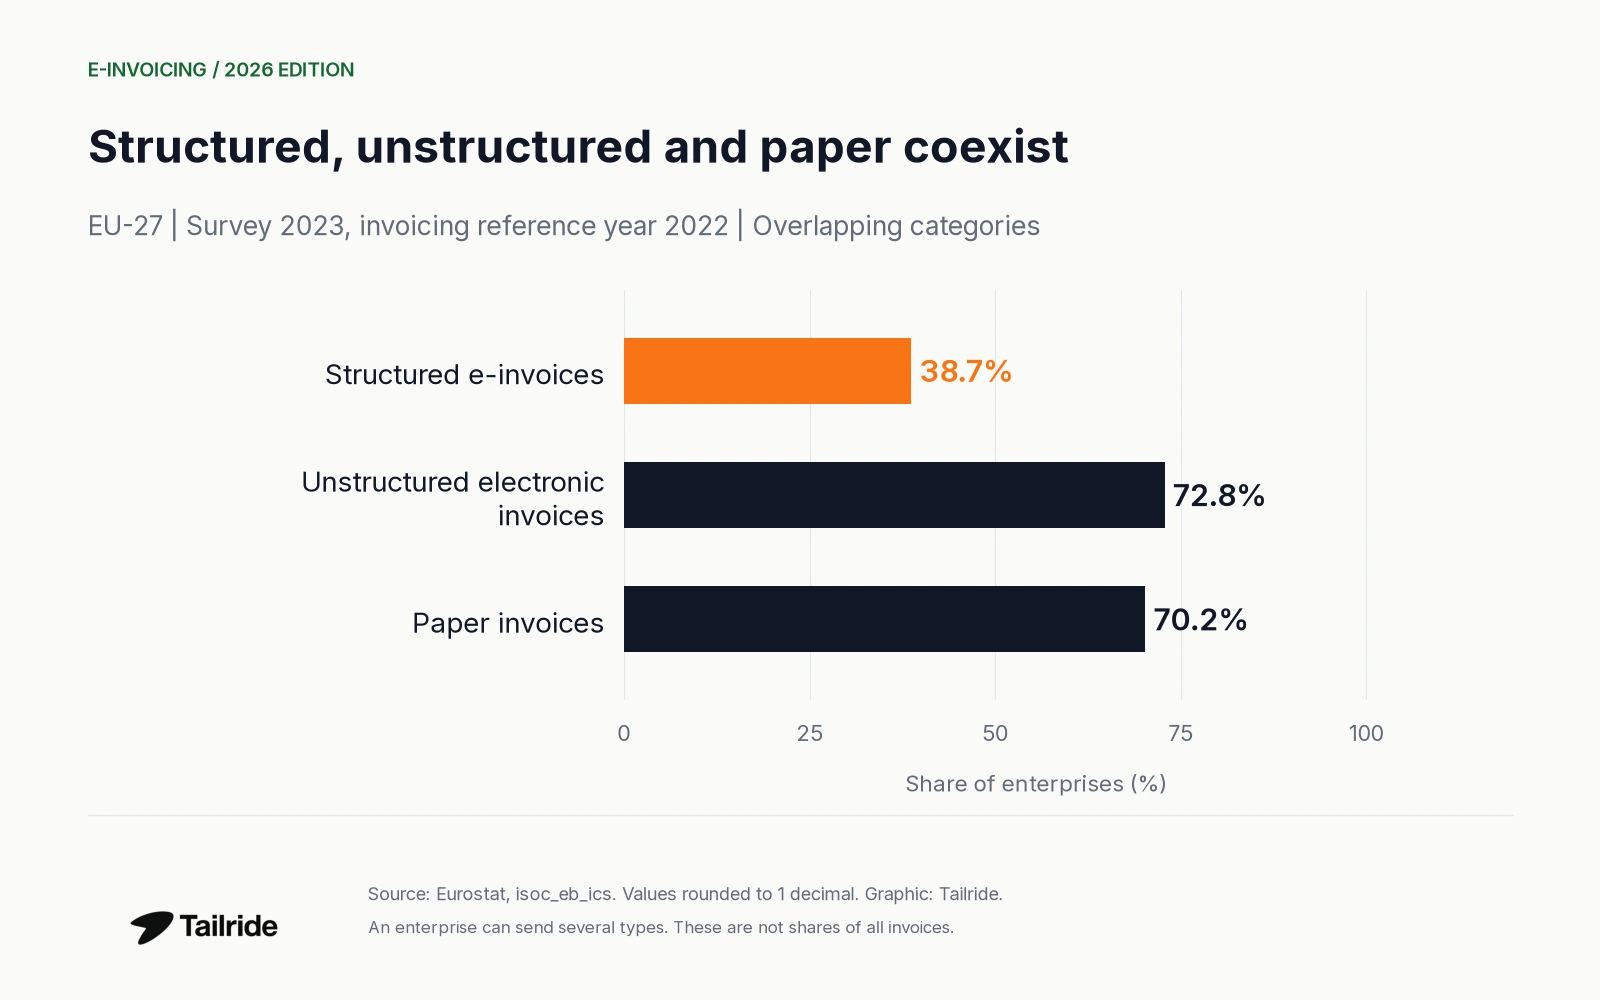
Figure 3. EU-27 enterprises sending each invoice type. Multiple invoice types can be reported by the same enterprise.
The 72.84% unstructured-electronic figure does not mean that 72.84% of invoices were PDFs. Likewise, 70.24% sending paper does not imply that paper accounted for most transaction volume. A business issuing one paper invoice and thousands of structured invoices can appear in both categories.
Documented e-invoice volumes in 2025
The following observations are reported by platform operators or public authorities. They provide evidence of actual activity, but they are not comparable national totals. A provider's processed documents, a government gateway's submissions and a public buyer's received invoices have different boundaries. A document can also pass through more than one system, so these figures must not be summed into a European total.
| Country / system | Reported 2025 volume | What is counted |
|---|---|---|
| Germany / DATEV | More than 64 million | E-invoices processed through DATEV systems; provider activity |
| France / Chorus Pro | More than 84 million | Invoices received by Chorus Pro; public-sector platform |
| Spain / FACe | 19,471,635 | Invoices submitted to FACe, including its repository |
| Portugal / FE-AP | 1,574,088 | Supplier invoicing documents sent to FE-AP |
| Netherlands / Rijksoverheid | 1,954,135 | E-invoices received by ministries, judiciary and Defence |
| Italy / Sogei | More than 2.4 billion | E-invoices acquired, as reported by Sogei |
Sources are linked in each row. Sogei's original report is linked through a publicly available PDF copy hosted by Money.it. Its wording is “more than 2.4 billion”; that lower-bound qualifier is retained. The DATEV and Chorus Pro figures also retain their “more than” qualifiers.
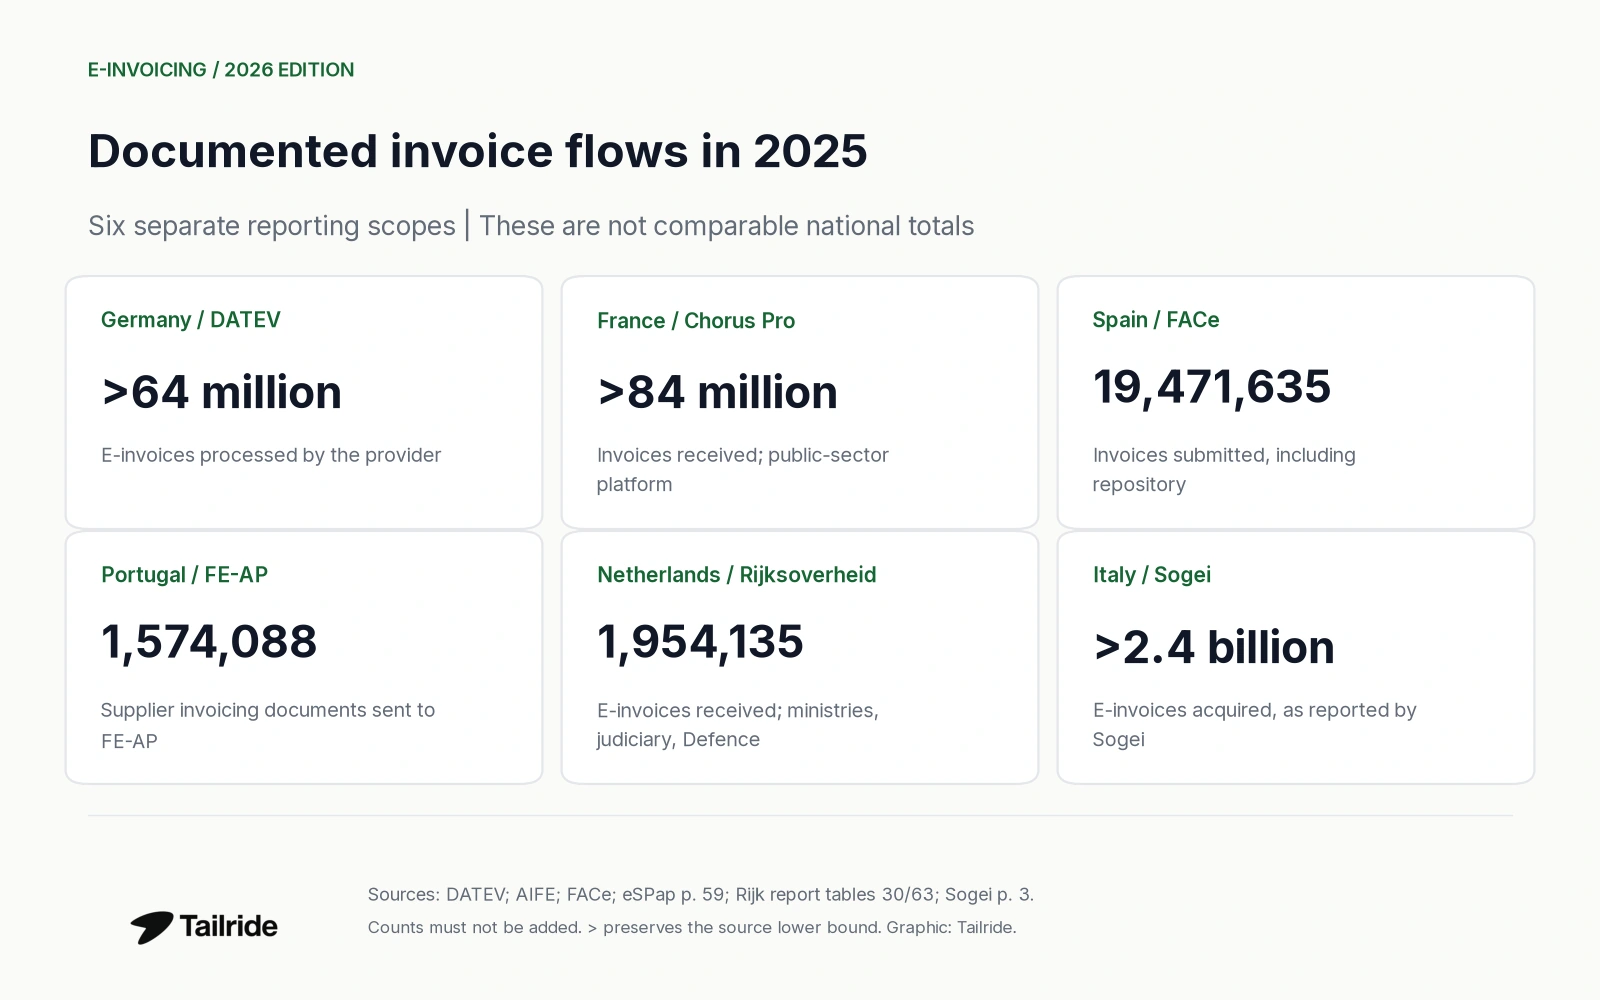
Figure 4. Six separately scoped 2025 invoice flows. The cards deliberately have no common ranking axis.
Spain's FACe dashboard reports 18,799,510 submissions in 2024 and 19,471,635 in 2025: an increase of 3.6%, calculated from the annual totals and rounded to one decimal. This is growth within FACe, not growth in all Spanish B2B e-invoicing. FACe annual series
The Dutch government report illustrates why both counts and shares matter. Received e-invoices fell from 2,062,512 in 2024 to 1,954,135 in 2025, while their published share of all invoices rose from 83.8% to 86.6%. The denominator also declined. These are the report's figures for ministries, the judiciary and Defence, not an enterprise adoption rate for the Netherlands. Tables 30 and 63
What the statistics mean for accounting teams
The evidence supports planning for a mixed incoming-document stream. Enterprise adoption tells you whether a supplier has used structured invoicing; it does not establish that every invoice from that supplier will arrive in the same format. Platform volume also does not tell you whether an invoice has been approved, paid or correctly coded.
Tailride's invoice workspace documentation describes direct reading of supported structured e-invoice files, alongside handling of ordinary PDF and scanned documents. Original XML files remain available. Those are product capabilities; none of the industry statistics above is a measured Tailride performance result.
For file differences and processing examples, see ZUGFeRD, Factur-X and XRechnung. For cost, exceptions and payment benchmarks, use the separate Invoice Management Statistics article.
Frequently asked questions
What percentage of European companies use e-invoicing?
For the specific indicator used here, Eurostat reports 38.68% of covered EU enterprises with 10+ persons employed sending structured e-invoices. It is the 2023 survey observation about 2022 invoicing, not a live 2026 rate or a figure for every European business. Data; reference period
Which country has the highest adoption in this comparison?
Italy, at 97.46%, has the highest value among the six selected countries. The measure counts enterprises sending structured invoices. It does not say that 97.46% of all Italian invoices were electronic. Eurostat
Does an emailed PDF count as a structured e-invoice?
An ordinary unstructured PDF does not qualify under the Eurostat survey definition. The structured-data distinction is essential when comparing adoption figures. Hybrid documents carrying structured data should not be classified solely by their PDF extension. Methodology
Can these platform volumes be added into a market total?
No. Their populations, channels and document definitions differ, and the same invoice may be represented in multiple systems. Use each count within the operator's stated scope and period.
Methodology and limitations
Sources were checked on October 22, 2026. Eurostat's retrieved dataset was updated on July 17, 2025; its latest available time for these indicators was 2023. The 2023 questionnaire explicitly asks about 2022 invoicing. The published activity aggregate is C10–S951 excluding K, and the comparison selects enterprises with at least 10 persons employed. This is a defined statistical population, not every registered company.
Tables retain two decimal places for Eurostat values; charts round to one decimal. France's b flags are preserved. Portugal's 50–249 size-class value is unavailable with a u reliability flag; no value is estimated. Sampling bases are not reverse-engineered from percentages, and the country observations are not pooled into a new average.
Operational figures cover full calendar year 2025, with their original document and platform boundaries. No annual total is extrapolated from partial 2026 data. Percentage-point differences and FACe growth are Tailride calculations from cited values. Charts are Tailride visualizations, not graphics endorsed by the source organizations.
