AI in Accounting Statistics 2026: Adoption, ROI & Barriers
Verified AI in accounting statistics for 2026: adoption, reported uses, ROI and barriers, with survey methods, original sources and downloadable charts.

By Tailride · Sources checked October 22, 2026
81% of surveyed tax and audit firm professionals used AI at least several times a week in 2026, according to Thomson Reuters. That finding comes from 538 respondents across 40 countries, rather than a census of accounting firms. In a separate US survey commissioned by Intuit, 88% of 725 accounting and bookkeeping professionals reported AI use for at least one client service during the previous 12 months. Thomson Reuters; Intuit
The gap between those percentages is not a contradiction: the surveys ask different people different questions. This reference separates adoption, actual uses, reported return on investment and implementation barriers. The 2026 title identifies this edition; each observation keeps its own period and population.
Key AI in accounting statistics
| Statistic | Value | Period and population | Source |
|---|---|---|---|
| US respondents: AI in at least one client service | 88% | May 2026; 725 US accounting/bookkeeping professionals; past 12 months | Source |
| AI used at least several times a week | 81% | March–April 2026; 538 tax/audit firm professionals, 40 countries | Thomson Reuters |
| Unauthorized AI tools used in daily work | 35% | March–April 2026; 538 tax/audit firm professionals, 40 countries | Thomson Reuters |
| Clear, measurable ROI reported | 20% | July–August 2026; North America; AI-active base ≈380 | Financial Cents |
| Time to learn or implement is the biggest barrier | 41% | July–August 2026; North America; full sample 486 | Financial Cents |
| Tax research mentioned as a current use | 57% | May–July 2026; 370 AI Lab applicant answers; self-selected | AI Lab |
Sources: the original publishers linked in each row. These percentages must not be averaged into a global adoption rate. Individual use, firm-level adoption, a named task and measurable ROI are different indicators.
US adoption: broad use does not mean default use
Intuit's May 2026 survey of 725 US accounting and bookkeeping professionals provides a useful distinction between having used AI and making it a routine part of work. Participants came from paid online audience pools and partner networks; 59% owned an accounting or bookkeeping business and 41% worked within a firm. Methodology
| Indicator | Published share | Definition |
|---|---|---|
| AI used for at least one client service | 88% | During the previous 12 months |
| AI used for at least one firm operation | 86% | During the previous 12 months |
| AI embedded as the day-to-day default | 30% | Separate question about depth of use |
| AI used situationally | 54% | Separate question about depth of use |
Source: Intuit, 2026 Accountant Technology Survey. The first two groups overlap, and the depth-of-use answers should not be added to the service-use percentages. These are respondent reports about their work and firms, not verified counts of every US practice.
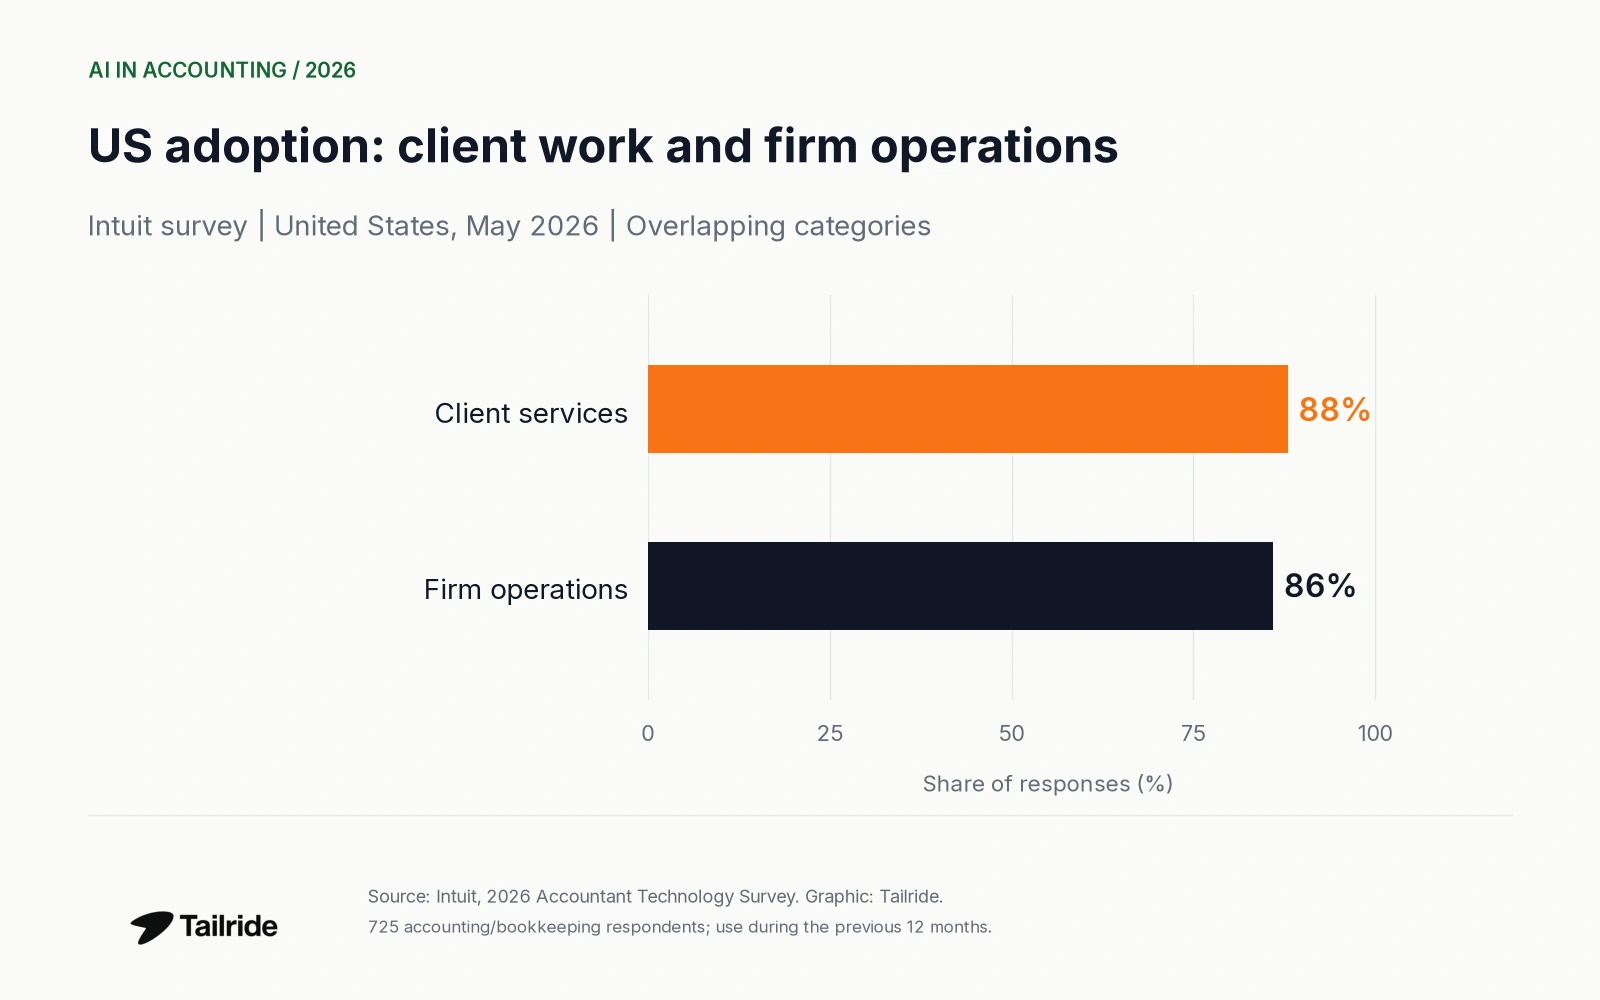
Figure 1. US respondents reporting AI for client services or firm operations during the past 12 months. Survey n=725; categories overlap. Source: Intuit; graphic: Tailride.
A firm can have used a chatbot for one client email without deploying AI across its bookkeeping process. The 88% figure therefore cannot support a claim that 88% of accounting work is automated, or that 88% of firms have autonomous accounting systems.
International evidence: frequency and authorization
The Thomson Reuters tax and audit edition surveyed 538 professionals in March and April 2026 across 40 countries, with approximately one third of responses from the US. Its 81% figure refers to AI use at least several times a week. The report also says 35% use AI tools their firm has not authorized in day-to-day work. Report and methodology
These two answers are not mutually exclusive. A regular user can also use an unauthorized tool. They cannot be subtracted to calculate an authorized-adoption rate, and the country mix does not justify applying either percentage to a particular European market.
The important measurement distinction is between frequency and organizational control. Neither tells us how many invoices, returns or client deliverables AI completes without review. A product's installed base, individual experimentation and controlled deployment need separate evidence.
AI use-case statistics: what respondents report
The AI Lab for Accountants published a survey of 437 applicants collected May 5–July 22, 2026. The current-use question has 370 answers. Respondents selected themselves into an AI-focused community, making this a portrait of an interested segment rather than a profession-wide adoption estimate. The report does not publish a geographic breakdown. AI Lab methodology
| Reported current use | Share of answers |
|---|---|
| Tax research | 57% |
| Client email and communications | 42% |
| Memos and document writing | 29% |
| Data cleanup and analysis | 20% |
| Workflows and automation | 15% |
| Return preparation and review | 14% |
Source: AI Lab, “What they use AI for today”. Free-text answers were coded into themes; one response can count toward multiple themes. Percentages therefore do not need to total 100%.
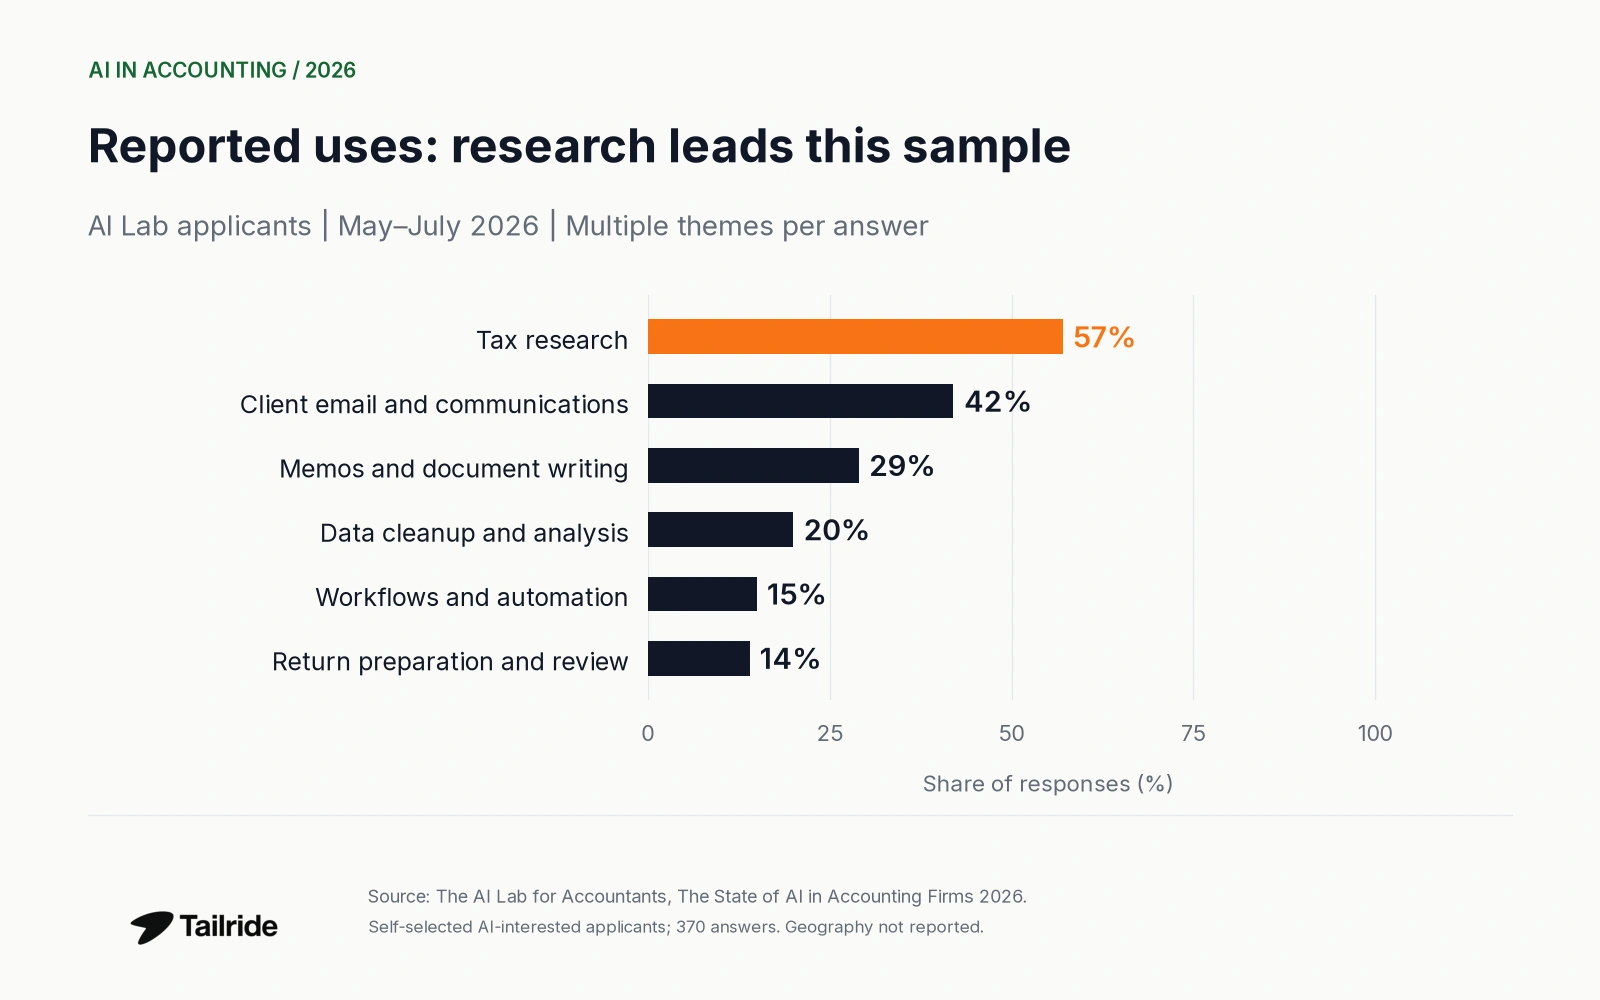
Figure 2. Themes mentioned in current AI uses, n=370 answers from self-selected AI Lab applicants. These are not national prevalence rates.
Research and communication appear more frequently than workflow automation in this sample. That observation describes the respondents' reported uses; it does not measure the accuracy of AI output or show that the most-mentioned task delivers the highest return. Nor can the 15% workflow figure be compared directly with Intuit's 88% client-service figure: the questions, samples and coding methods differ.
AI return on investment: what has actually been reported?
Financial Cents surveyed 486 North American accounting and bookkeeping professionals between July 15 and August 7, 2026. Its methodology separates the full sample from an AI-active base of approximately 380 respondents. The ROI question belongs to the AI-active base; an exact item-level count is not separately stated. Financial Cents
| Reported return on AI investment | Share of AI-active responses |
|---|---|
| Promising, but hard to quantify | 52% |
| Still implementing / too early to tell | 25% |
| Clear, measurable ROI reported | 20% |
| No payoff reported | 4% |
Source: Financial Cents, “The Payoff Problem”. Published rounded shares total 101%; the table preserves them without rescaling. “Measurable” describes respondents' characterization of their return, not an independent audit of their financial results.
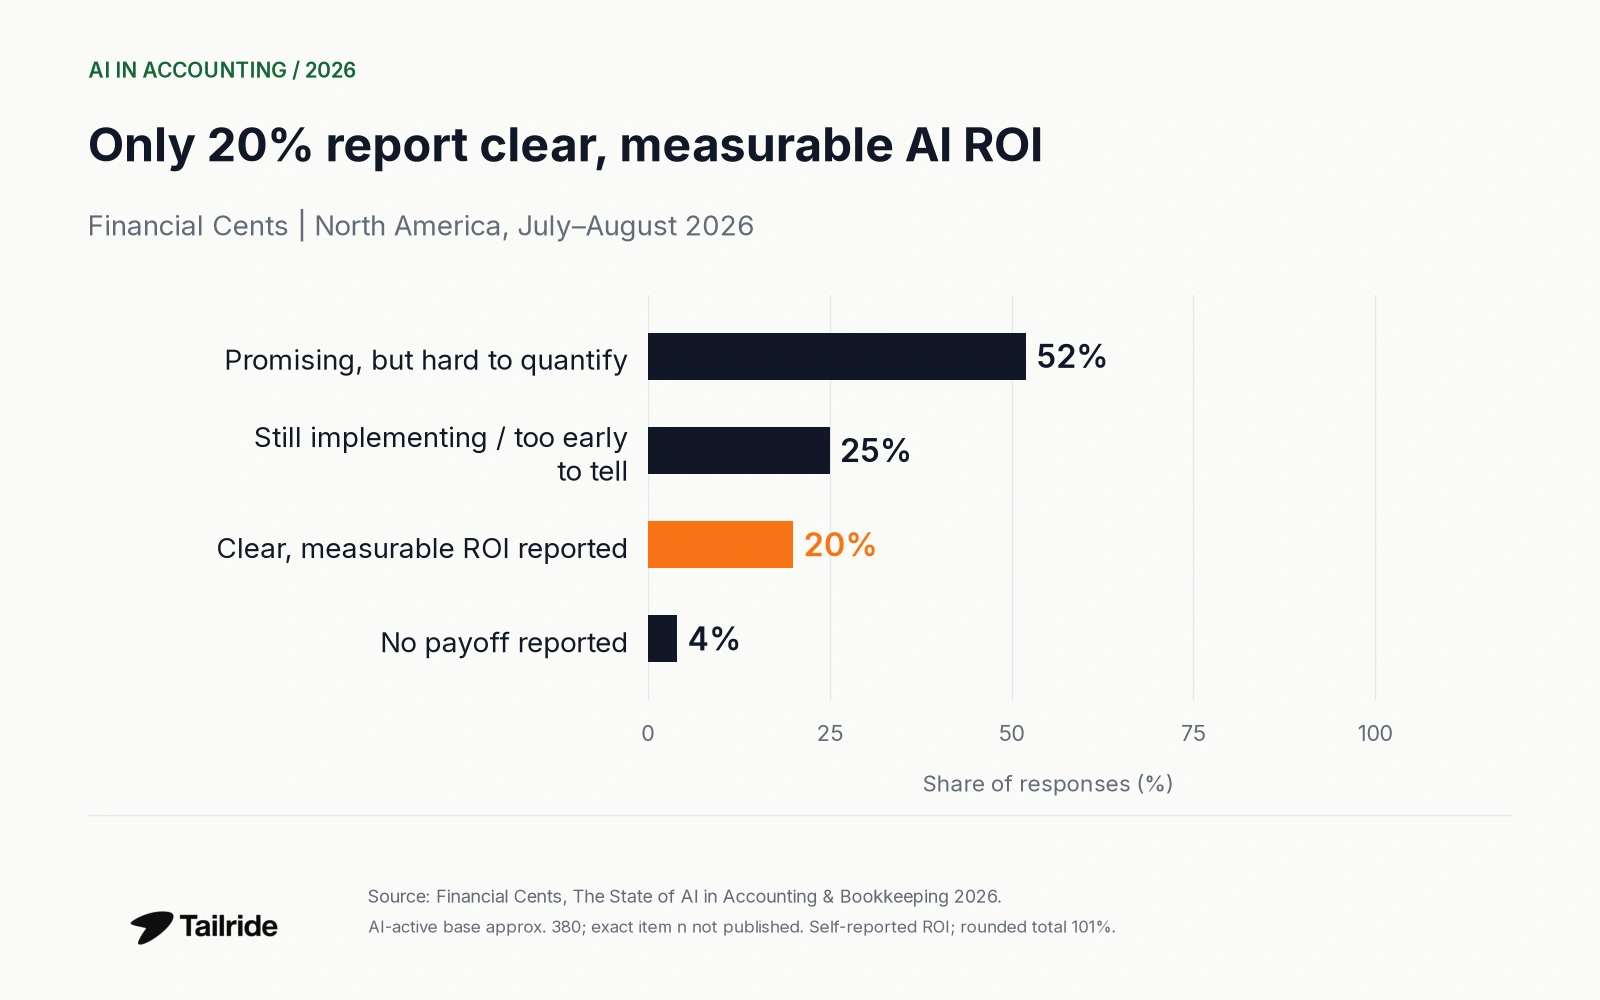
Figure 3. Reported ROI among the survey's AI-active respondents, approximately 380. Rounded shares total 101%; the bars are not a normalized 100% distribution.
The clearest finding is the gap between use and evidence of value: 20% reported a clear, measurable return, while 52% found the investment promising but hard to quantify. It would be incorrect to turn that 20% into “AI improves productivity by 20%.” It is a share of respondents selecting an answer, not a magnitude of productivity improvement.
No universal hours-saved estimate is calculated here. A useful comparison would need the same task, workload, review requirements and measurement period. Self-reported benefits should also remain separate from controlled experiments and forecasts of future savings.
Barriers to getting more value from AI
The same Financial Cents report asks the full sample of 486 about the biggest barrier to getting more value from AI. Time to learn or implement leads the selected results below. This question covers existing users as well as less active firms; it is not restricted to organizations refusing to adopt AI. Source
| Selected barrier to more value from AI | Share of full sample |
|---|---|
| Time to learn or implement | 41% |
| Trust and accuracy | 21% |
| Data security and compliance | 11% |
| Skills and knowledge | 9% |
| Cost | 6% |
Source: Financial Cents, “How Firms Are Learning AI”. Selected categories only; the table is not the full answer distribution. It must not be combined with the report's separate non-active-user barrier question.
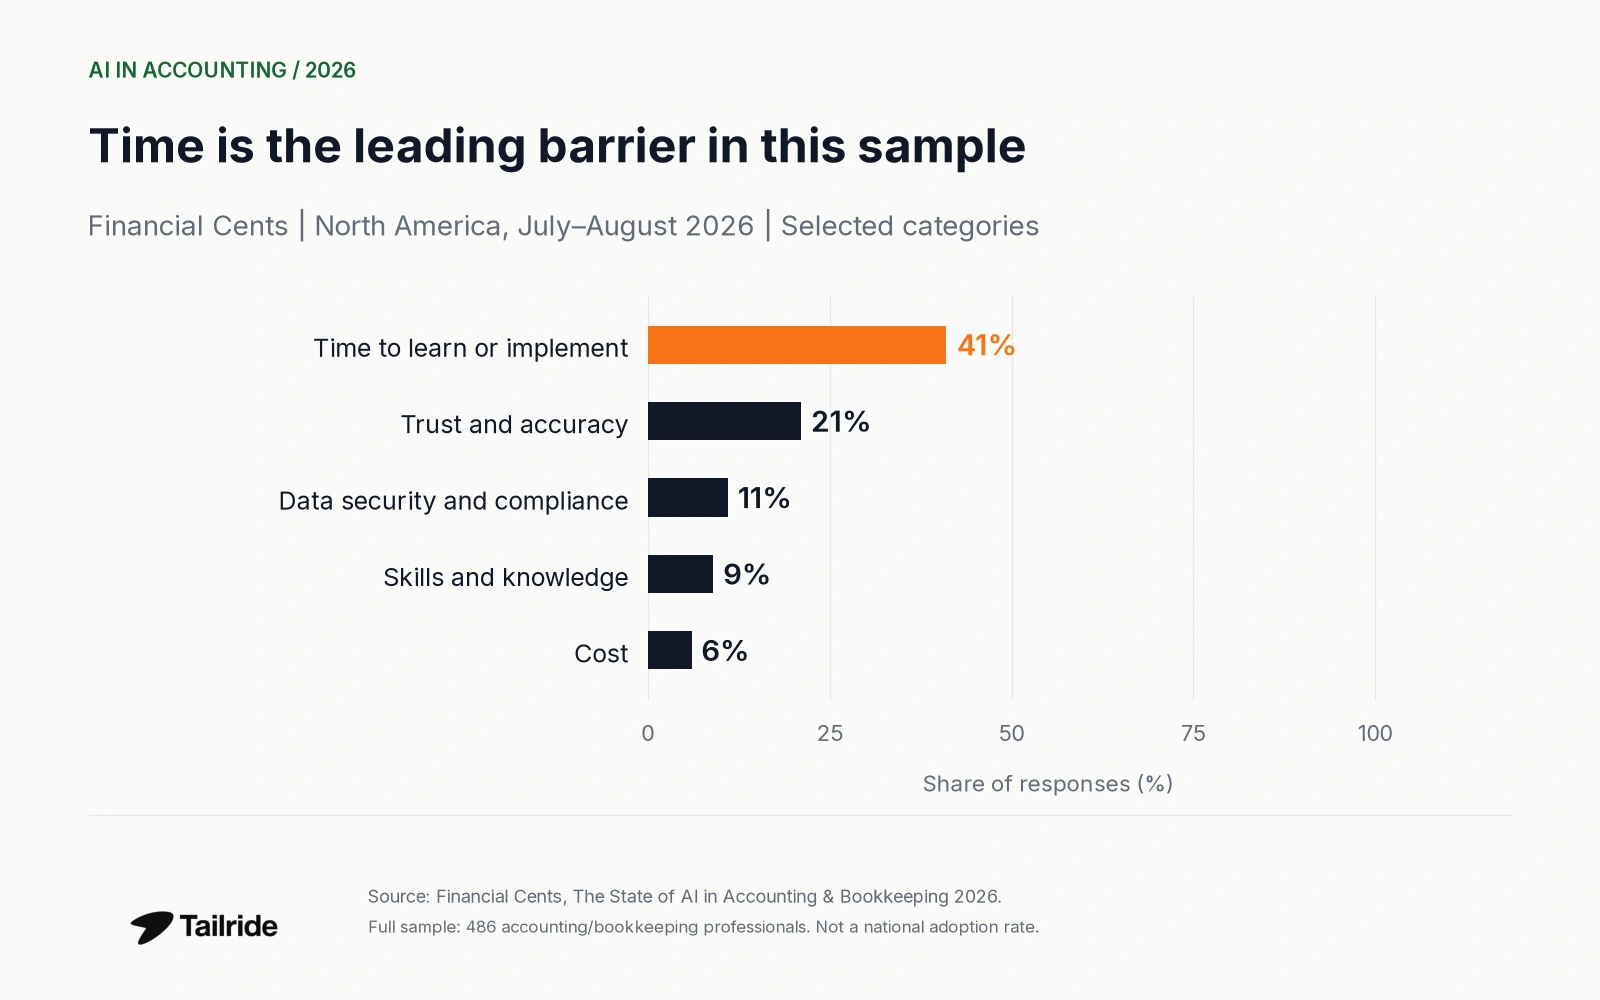
Figure 4. Selected barriers reported by the full North American sample, n=486. Time, trust and security refer to different response categories.
The 41% time figure does not mean implementation consumes 41% of a workweek. Similarly, a respondent citing accuracy concerns has not necessarily measured a specific error rate. Survey concerns are useful indicators of implementation friction, but they do not substitute for operational performance data.
What these statistics can and cannot establish
The evidence supports a distinction between widespread experimentation, routine use and measured results. It does not provide a single global adoption percentage, a causal estimate of profit improvement or a reliable ranking of AI vendors.
Firm-size comparisons require the same question and a published sample for each size band. An overall survey can include practices of different sizes without supporting a precise small-versus-large adoption chart. We have therefore not filled missing size or country breakdowns with workforce totals from another dataset.
For the practical side, see Bookkeeping AI, ChatGPT for Accounting and Claude for Accounting. The separate accounting industry statistics article covers market size and workforce; invoice management statistics covers processing costs, exceptions and payment benchmarks. This page remains the survey-data reference for AI adoption and reported outcomes.
Tailride's AI invoice processing and workflows for accounting firms are examples of operational applications. The independent surveys above do not measure Tailride's performance or establish a guaranteed saving from using it.
Frequently asked questions
What percentage of accountants use AI in 2026?
There is no defensible single worldwide percentage in these sources. Thomson Reuters reports 81% using AI at least several times a week among 538 tax/audit firm professionals across 40 countries. Intuit reports 88% using AI for at least one client service in the previous year among 725 US respondents. The definitions differ. Sources; Intuit
How many accounting firms have measurable AI ROI?
In the Financial Cents survey, 20% of AI-active responses reported clear, measurable ROI. The base is approximately 380 North American respondents, not all accounting firms globally, and the result is self-reported. Source
What is the biggest barrier to more value from AI?
Time to learn or implement was the leading category at 41% in the full Financial Cents sample of 486. This is one survey's result, not an established universal ordering of barriers. Source
Can adoption percentages be compared between countries?
Only after checking the question, population, period, AI definition and sampling method. A figure for regular personal use cannot be ranked directly against a figure that includes firm pilots or a specific analysis task.
Methodology and source notes
Sources were checked on October 22, 2026. This article compiles published research; Tailride did not conduct the underlying surveys. The source tables retain reported percentages and denominators. Graphs are Tailride visualizations of those data, with zero-based percentage axes.
The sources represent different populations: tax/audit professionals, US accounting and bookkeeping respondents, self-selected AI-community applicants and a North American practice-software survey. The AI Lab applicant sample is explicitly self-selected. Financial Cents does not publish a probability-sampling frame in the inspected methodology. Vendor-sponsored findings are attributed to their publishers and are not presented as official population statistics.
Percentages are not pooled across surveys or converted into counts of the global workforce. Missing item-level sample sizes remain missing. ROI is labeled as reported; expectations are not restated as achieved benefits. No chart estimates an industry-wide error reduction, time saving, job loss or Tailride-specific result.
