Invoice Management Statistics 2026: Costs, Errors & Automation
Verified invoice management statistics on processing costs, exceptions, automation and late payments, with original sources, tables and charts for 2026.

By Tailride · Last verified October 21, 2026
Invoice management statistics show how much work sits between receiving a supplier bill and having a complete, usable accounting record. In Ardent Partners' 2026 research, the average processing cost is $9.90 per invoice, while the invoice exception rate averages 19.9%. Both figures are published in the report sponsor's public summary.
This collection brings together invoice processing benchmarks, automation adoption, late payments and e-invoicing market estimates. Each figure retains its source period and population. A 2026 report may describe earlier survey responses; a market forecast is identified as a forecast.
The focus is incoming supplier invoices and the work around them. Customer-payment statistics appear in a separate section because receivables delays affect the businesses that send those supplier invoices.
Key invoice management statistics at a glance
| Metric | Figure | Period and scope | Source |
|---|---|---|---|
| Average cost to process an invoice | $9.90 | 2026 AP report; industry average | Ardent Partners / Medius |
| Best-in-Class processing cost | $2.67 | Same 2026 report | Ardent Partners / Medius |
| Median cost per AP invoice | $6.00 | APQC database; 5,846 organizations; accessed October 2026 | APQC |
| Average invoice exception rate | 19.9% | 2026 AP report | Ardent Partners / Medius |
| Businesses without fully automated bill management and payment | 74% | Intuit's 2026 small-business report | Intuit QuickBooks |
| Businesses reporting some invoices overdue by 30+ days | 59% | Intuit's 2026 small-business report | Intuit QuickBooks |
| Estimated annual global bill/invoice volume | At least 560 billion | Billentis 2024 estimate; not a 2026 count | Billentis, p. 54 |
These figures describe different things. The APQC median and Ardent average come from separate research programs. The overdue-invoice figure is the share of businesses reporting a problem, not the percentage of all invoices paid late.
Invoice processing cost statistics
There is no single universal cost per invoice. The benchmark depends on the organization, process boundaries and whether the publisher reports a mean, median or selected performance group.
| Benchmark | Cost per invoice | What the number represents |
|---|---|---|
| Ardent Partners, 2026 | $9.90 | Industry average, as summarized by sponsor Medius |
| Ardent Partners, 2026 | $2.67 | Best-in-Class group in the same report |
| APQC, accessed October 2026 | $6.00 | Cross-industry median from 5,846 organizations |
Sources: Ardent Partners / Medius; APQC's underlying measure.
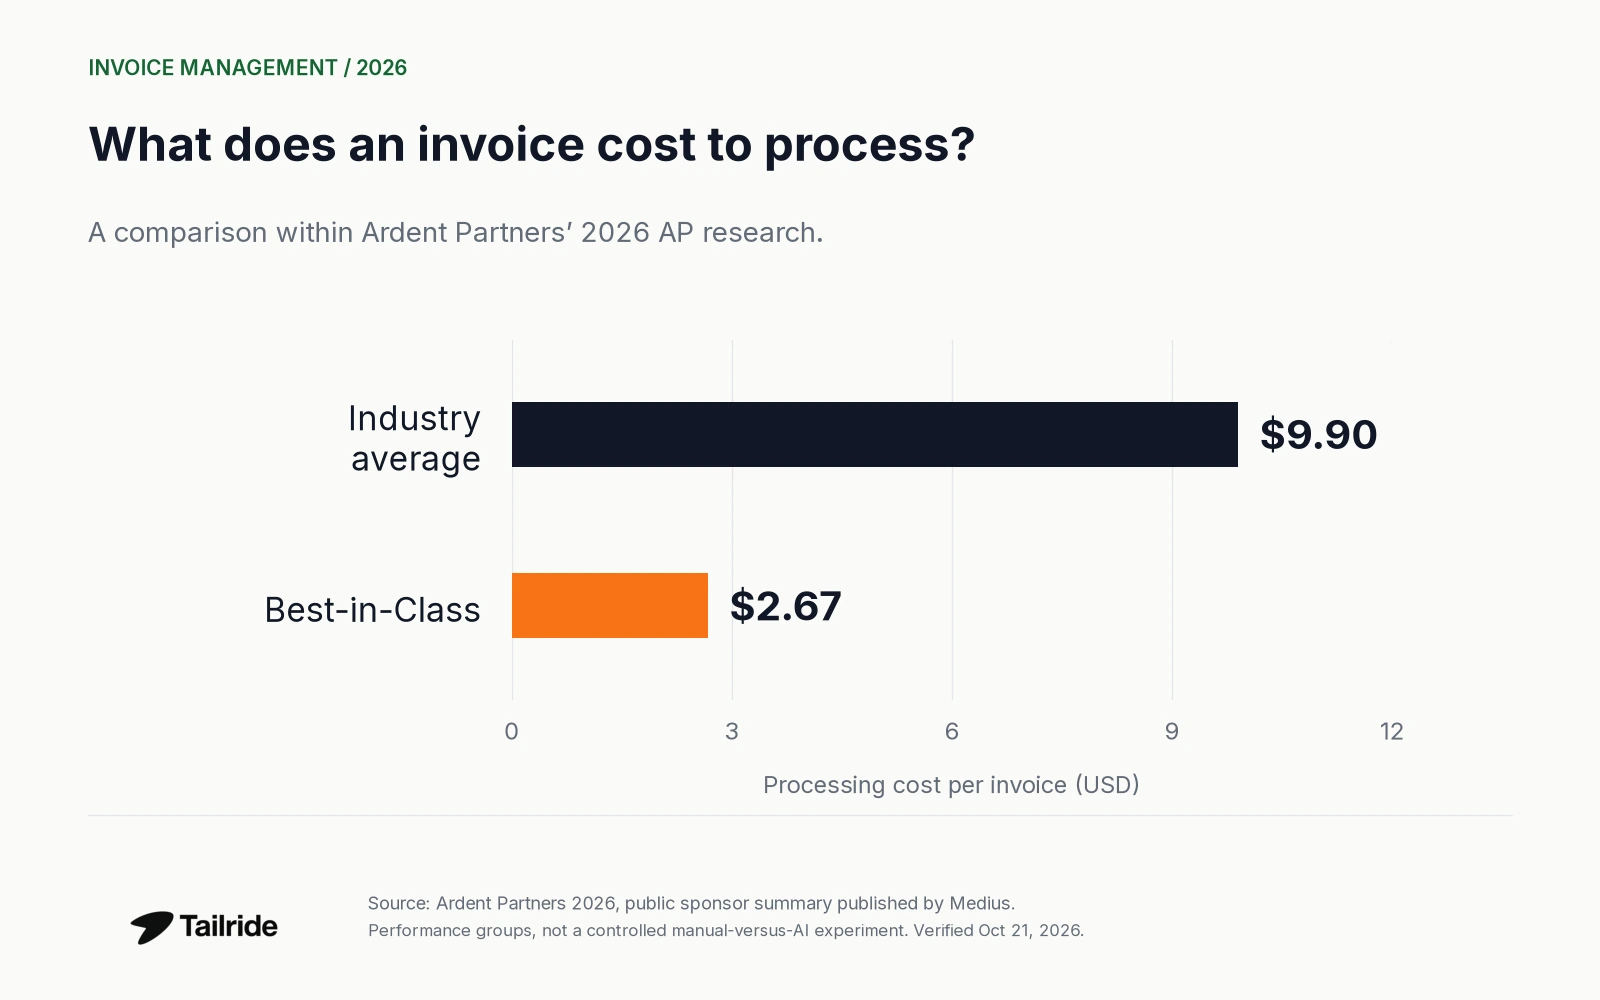
Figure 1. The cost comparison uses two groups from one report. It does not represent a controlled test of manual processing against AI.
APQC's measure includes personnel, systems, overhead, other internal costs and outsourced services. Its public measure page does not give one common collection year for the entire database. The median is a peer benchmark, not a quoted software price. Source: APQC
For a finance team, this distinction changes the business case. A low extraction fee does not describe the total work of locating a document, checking its details, resolving an exception and preparing it for the books. Compare the same process boundary before using a published benchmark as a target.
For example, a team processing 500 invoices a month would release $6,000 of annual process cost for every $1 reduction per invoice: 500 × 12 × $1. This is an illustrative calculation, not a measured Tailride result or a forecast of cash savings.
Invoice processing time and supplier workload
Processing time, payment terms and days overdue are separate clocks. A quick data extraction step does not establish how quickly an invoice reaches approval or payment.
| Measure | Published figure | Research context |
|---|---|---|
| Average invoice processing time | 8.2 days | Ardent's State of ePayables 2025; public analysis published January 2026 |
| AP staff time spent dealing with suppliers | 21.9% | Same 2025 research |
| Supplier time to payment | 32 days | Median of reported average payment times; large UK businesses; 2025 data published July 2026 |
Sources: Ardent Partners; UK Department for Business and Trade.
These are not competing estimates of the same task. The UK measure concerns how reporting businesses pay their suppliers; the Ardent measure concerns invoice processing. Neither should be described as the number of minutes needed to read a PDF.
When measuring your own workflow, record receipt, capture, review, approval and payment separately. A shorter extraction step will have limited effect if an invoice waits in a personal inbox or an approval queue. For implementation details, see Tailride's invoice processing workflow guide.
Invoice error and exception statistics
The 2026 Ardent summary reports invoice exception rates of 19.9% on average and 11.8% for Best-in-Class teams. Source: Medius
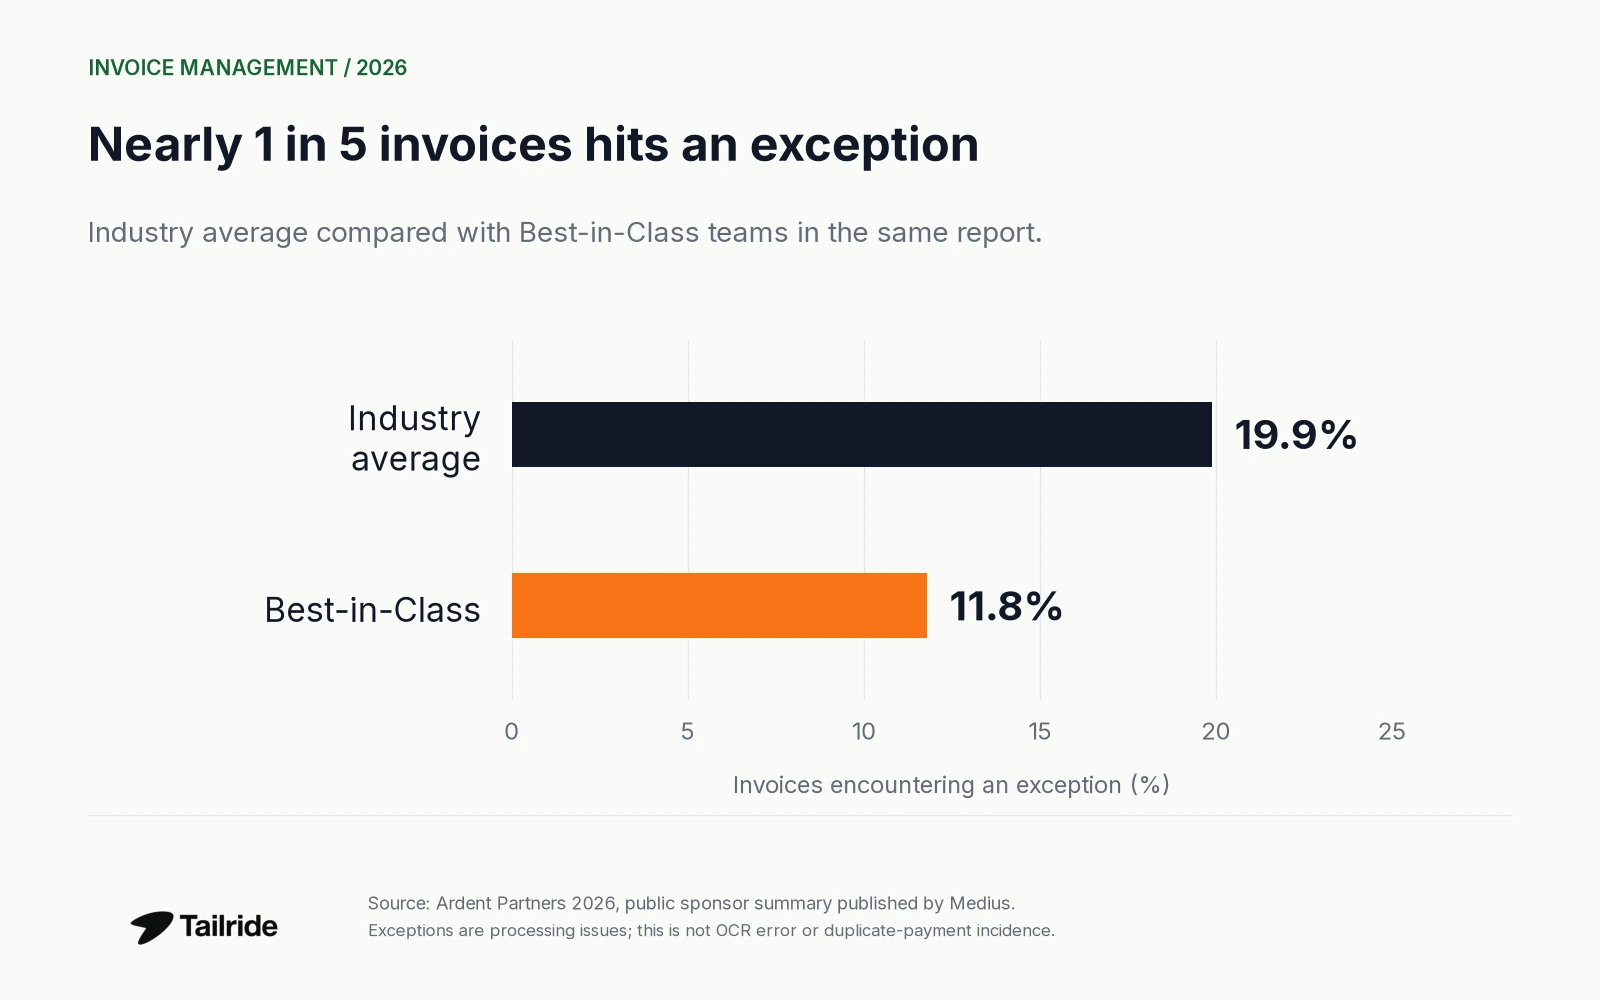
Figure 2. An exception is a workflow issue requiring attention. It is not automatically an incorrect invoice total or an OCR mistake.
Do not substitute one quality measure for another. Field extraction accuracy asks whether values were read correctly. Invoice exception rate asks whether a document encountered an issue in processing. Duplicate-payment rate asks whether a liability was paid more than once. A useful measurement plan defines the event and the denominator for each.
For example, an invoice may have correctly extracted amounts but still need someone to supply an account code. Conversely, a document can pass through a fast workflow and still require a later correction. Measure the quality of the accounting record as well as the speed of the handoff.
For businesses comparing performance, the practical question is: which exceptions require professional judgment, and which are caused by missing documents, incomplete fields or preventable handoffs?
Invoice automation and AI adoption statistics
Automation is progressing, but adoption does not mean the entire invoice lifecycle runs without people. Medius's summary of Ardent's 2026 research reports that 58% of AP organizations are using or piloting AI. The combined figure includes pilots. Source
Intuit's 2026 report separately finds that 74% of businesses do not have fully automated management and payment of bills. These two percentages concern different samples and definitions; they cannot be combined into a single adoption rate. Source: Intuit QuickBooks
A practical way to interpret an automation claim is to identify the stage covered:
| Stage | What to establish |
|---|---|
| Collection | Does the workflow obtain the document from its original source? |
| Extraction | Does it read the required fields and preserve the source file? |
| Preparation | Does the record have the coding and information the accounting system needs? |
| Review | Which records require a person, and why? |
| Delivery | Does the document reach the correct ledger or destination? |
| Payment | Is execution included, or handled by another system? |
This framework prevents a single automated task from being mistaken for a fully automated process. It also makes vendor claims easier to compare. There is no defensible universal AI invoice accuracy rate across every document format, field and test set; an accuracy claim needs those conditions to be meaningful.
Late invoice payment statistics
Late-payment research can measure businesses affected, invoice counts, invoice values or outstanding balances. The following figures retain those distinctions.
| Indicator | Figure | Population and period |
|---|---|---|
| Businesses with some invoices overdue by 30+ days | 59% | Intuit 2026 report; 47% in its reported prior-year comparison |
| Average amount owed to businesses with unpaid invoices | $17,700 | Intuit 2026 report; conditional on having unpaid invoices |
| Overdue share of B2B receivables | 22% | US suppliers in Atradius's 2026 report |
| Late-payment share by invoice count | 15% | Median reported share for large UK businesses; 2025 data |
Sources: Intuit QuickBooks, Atradius, UK Department for Business and Trade.
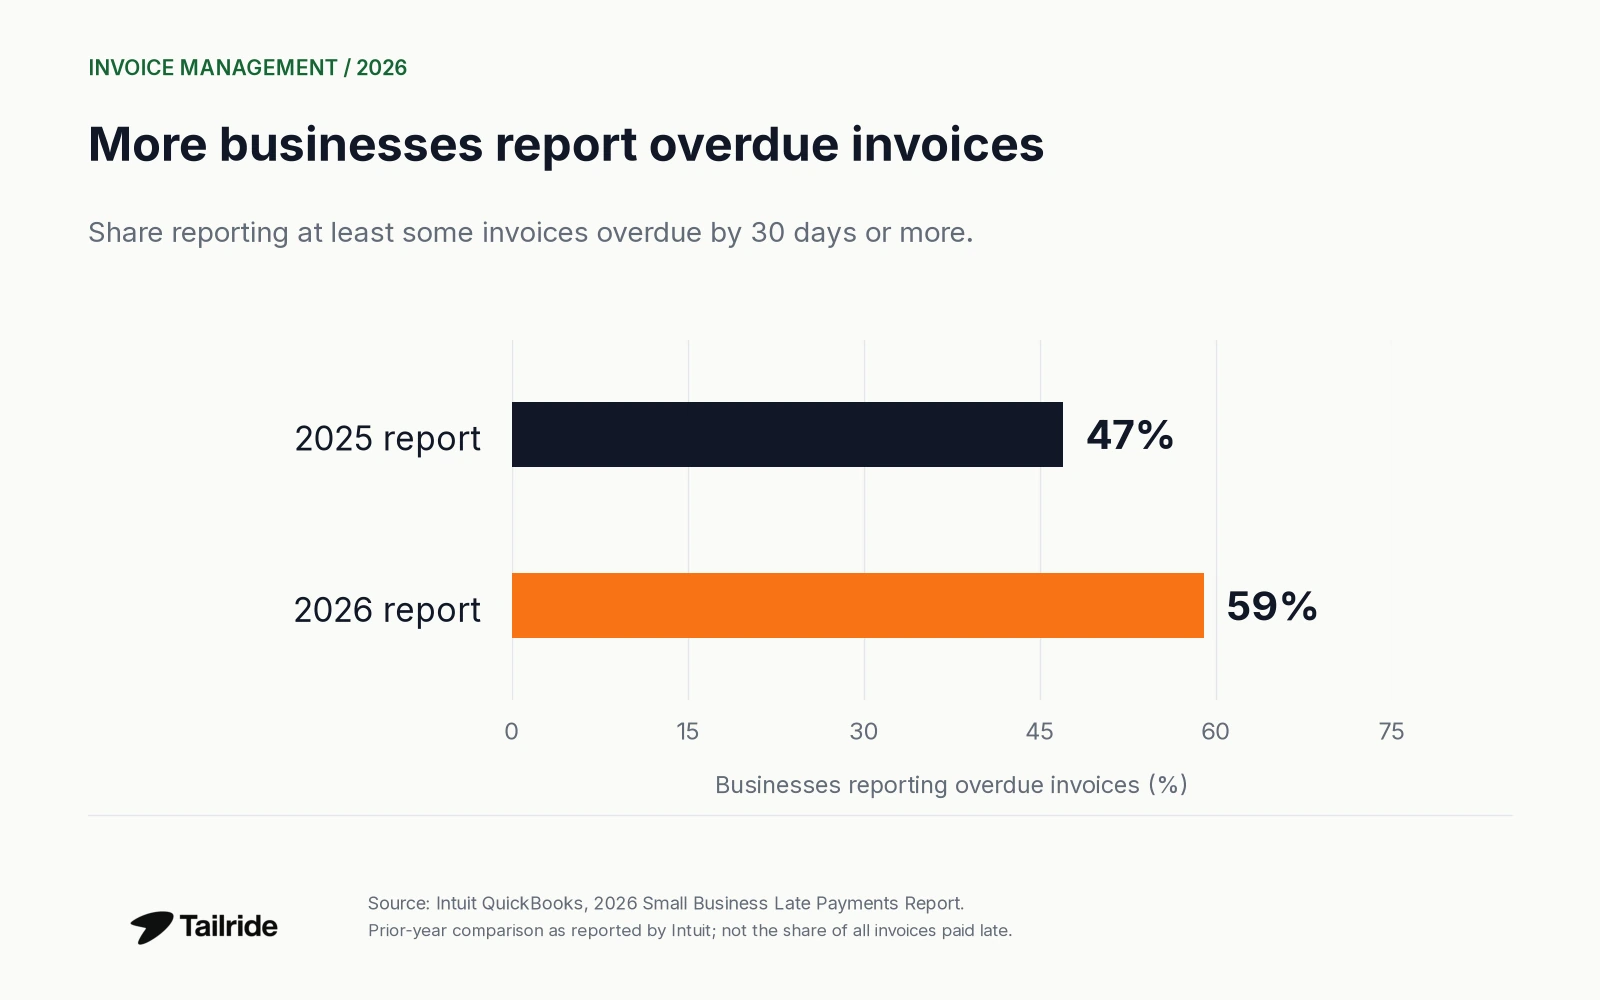
Figure 3. The increase is 12 percentage points. It describes businesses reporting overdue invoices, not the fraction of invoices unpaid.
The UK release also reports a 14% median late-payment share by invoice value. Its dataset contains 11,178 valid reports, not 11,178 distinct businesses; firms can report twice a year. Source: DBT
These results do not establish one global late-payment rate. A survey of small businesses with receivables, a survey of B2B suppliers and administrative reports from large buyers observe different parts of the payment chain.
For supplier-side context, a separate UK study estimates 86 staff hours a year chasing unpaid debtors per business affected by late payment. The research surveyed 1,455 businesses in January–February 2025 and combined survey results with economic analysis. Its definition includes overdue invoices and payment terms longer than 60 days. Source: London Economics / DBT, printed pp. 5 and 24
For an incoming-invoice workflow, the implication is to keep document completeness, payment readiness and customer collections visible as separate issues. Improving capture cannot guarantee that a customer has funds to pay.
E-invoicing volume and market statistics
Billentis estimated at least 560 billion bills and invoices worldwide annually in 2024, including about 125 billion exchanged electronically. These are analyst estimates from its 2024 report, retained here as dated market context. Source: Billentis, pp. 6 and 54
| Measure | Estimate or projection | Status |
|---|---|---|
| Annual global bill/invoice volume | At least 560 billion | 2024 estimate |
| Electronically exchanged volume | About 125 billion | 2024 estimate |
| Global e-invoicing and enablement market | $8.9 billion | 2024 estimated market value |
| Same market in 2028 | About $23.7 billion | Forecast made in 2024 |
Source: Billentis, pp. 6, 54 and 64. The market covers e-invoicing and related enablement solutions and services; it is not the entire accounting software market.
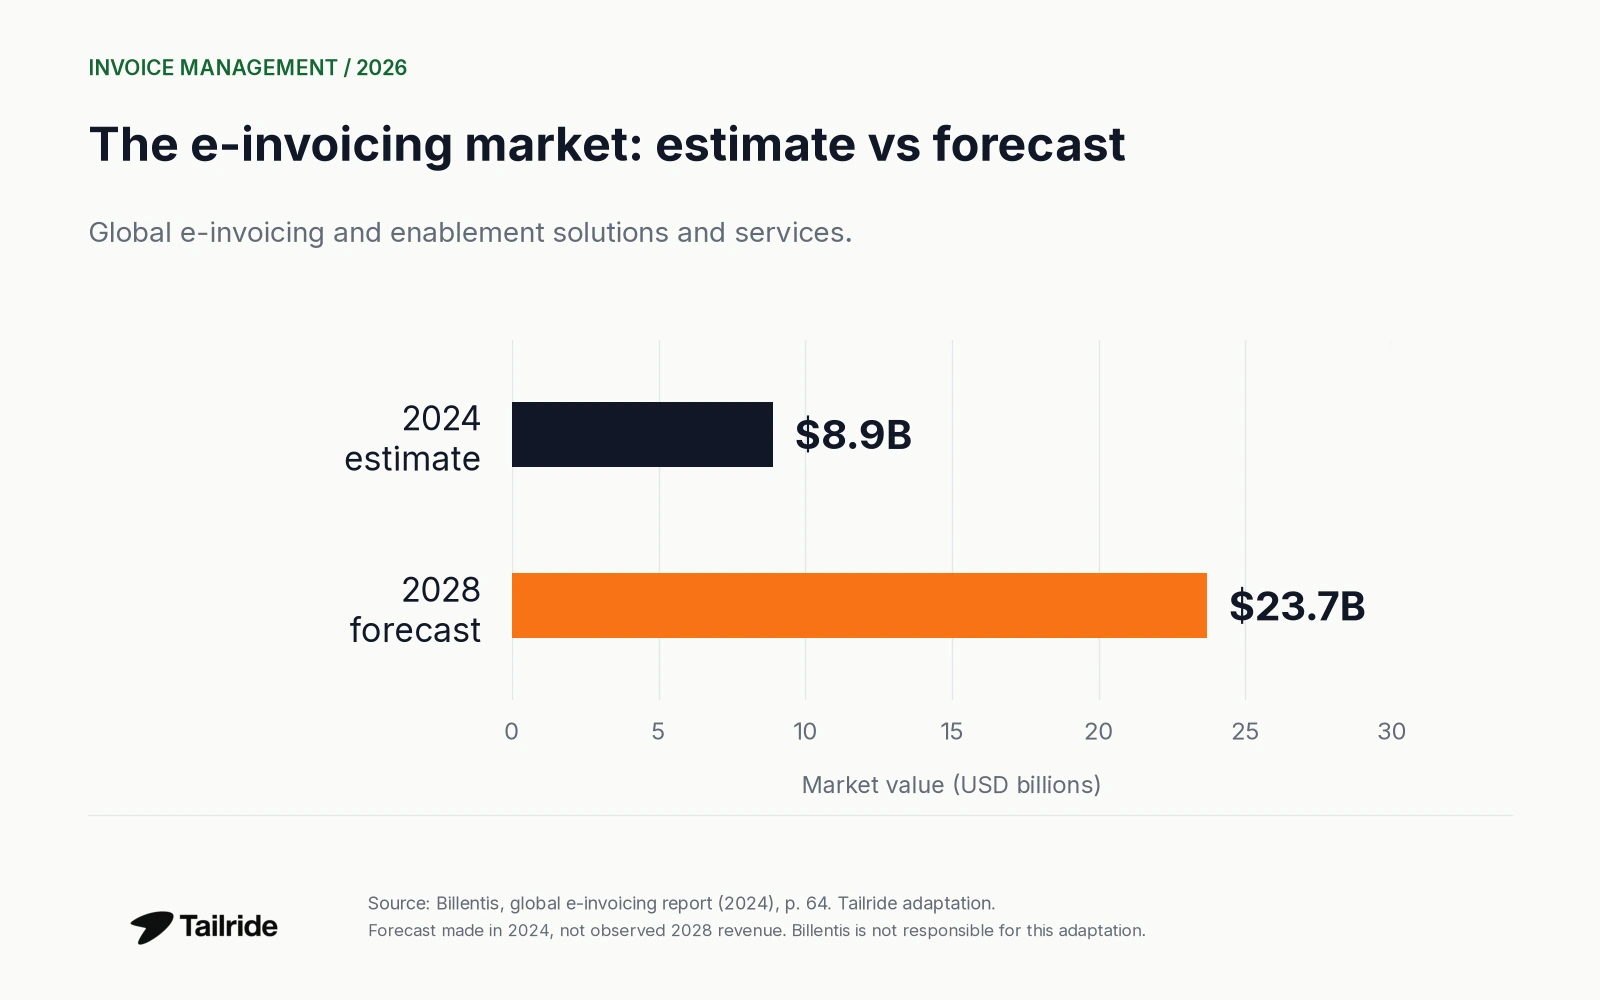
Figure 4. Tailride visualization of Billentis data. The 2028 bar is a forecast from 2024, not observed revenue. Billentis is not responsible for this adaptation.
Electronic delivery also needs a definition. In the European Commission's structured e-invoicing context, machine-readable formats support automated processing; an ordinary unstructured PDF is a different input. Source: European Commission, p. 7
For finance teams, this means the document mix matters. A workflow receiving structured files has a different extraction task from one receiving scanned receipts, PDF attachments or links to supplier portals. For the format differences, see ZUGFeRD, Factur-X and XRechnung.
What these statistics mean for invoice collection
The useful question for an SMB or accounting firm is where its own work begins. Does the measured processing time start when the supplier issues the invoice, when an employee finds it, or when it finally reaches the accounting system?
A benchmark starting after receipt will not show the effort of logging into a supplier portal or finding an attachment in a colleague's mailbox. Record that collection work explicitly when assessing the process. It belongs alongside extraction, review and export in your baseline.
Tailride addresses this collection and preparation stage. Its inbox scanning collects documents from connected email accounts, while its portal workflow retrieves invoices from supported supplier websites. The invoice workspace keeps originals with extracted fields so records can be reviewed before export. These capabilities describe the product workflow; the industry benchmarks above are not Tailride performance claims.
For teams working across multiple clients, see Tailride for accountants. For process recommendations, use the separate invoice management best practices guide.
Frequently asked questions
How much does it cost to process an invoice?
Ardent's 2026 public summary reports a $9.90 industry average and $2.67 for its Best-in-Class group. APQC publishes a separate $6.00 median. Compare definitions and peer groups before choosing a target. Ardent / Medius; APQC.
What percentage of invoices contain errors?
This collection does not establish a universal error rate. Its reported exception benchmarks measure processing issues, not the share of invoices with incorrectly extracted values. Use a source that defines the exact error, population and denominator for the comparison you need.
How long does invoice processing take?
Ardent's public analysis of its 2025 research reports 8.2 days on average. That is an invoice processing benchmark, not a PDF-reading time or a promise of payment within that period. Source
Are PDF invoices the same as structured e-invoices?
An ordinary PDF is unstructured. Some hybrid formats also contain machine-readable data. The relevant distinction is whether the receiving system can use structured fields directly. See the European Commission's definition and Tailride's format guide.
Methodology and sources
Tailride checked the linked public material on October 21, 2026. This is a curated secondary analysis, not an original survey. We prioritized research publishers, official statistics and public summaries supplied by research sponsors.
Ardent's 2026 figures are verified against Medius's public sponsor summary; we did not use inaccessible tables from the gated report. Ardent's own introduction describes research with 194 AP, finance and P2P leaders worldwide. APQC's database has a different sample and no single collection period stated on the public measure page. Ardent methodology context; APQC.
Intuit's late-payments article combines its ongoing Small Business Insights survey with a separate December 2025 survey of 1,305 US business owners. It does not assign a separate sample size to every statistic on the page. We preserve its reported comparison rather than treating it as a matched-company longitudinal study. Source
The UK payment-practices figures are medians calculated from business reports, not invoice-weighted national totals. Billentis's volume and revenue figures are estimates and forecasts from 2024. We do not pool these datasets or infer software-caused savings from differences between groups.
Sources
-
Medius: public summary of Ardent Partners' AP Metrics that Matter in 2026 - costs, exceptions and AI adoption.
-
APQC: total AP cost per invoice processed - median, sample and cost definition; accessed October 2026.
-
Ardent Partners: State of ePayables 2025 benchmark analysis - January 2026 publication; processing time and supplier workload.
-
Intuit QuickBooks: 2026 Small Business Late Payments Report - overdue invoices, balances and bill automation.
-
Atradius: US Payment Practices Barometer 2026 - overdue receivables; September 2026.
-
UK DBT: large-business payment-practices statistics for 2025 - published July 2026; medians from administrative reports.
-
Billentis: The global e-invoicing and tax compliance report - April 2024, updated August; pp. 6, 54 and 64.
-
London Economics / DBT: late-payments economic-impact research - July 2025; printed pp. 5 and 24 (PDF pp. 7 and 26).
-
European Commission: e-invoicing thematic report - structured-format definition, p. 7.
-
Tailride Docs: invoices - product workflow, checked October 2026.
-
Ardent Partners: 2026 research introduction - research population.
