Accounting Industry Statistics 2026: Market Size, Firms & Workforce
Verified accounting industry statistics for 2026: US and UK market size, firm counts, salaries, employment and student trends, with sources and charts.


By Tailride · Sources checked October 21, 2026
Accounting industry statistics describe several connected markets: the firms selling accounting services, the people working as accountants, and the students preparing to enter the profession. In the United States, the Census Bureau's quarterly revenue series for accounting, tax preparation, bookkeeping and payroll services adds up to $219.92 billion in 2025. That figure is a Tailride calculation from four published quarterly estimates, rather than a global market forecast. Census data via FRED
This reference focuses on the United States and the United Kingdom, with the Republic of Ireland included where the source combines it with the UK. The 2026 title identifies this edition of the research. Each statistic retains its actual measurement year, geographic coverage and definition.
Key accounting industry statistics
| Statistic | Figure | Period and scope | Source |
|---|---|---|---|
| US accounting, tax preparation, bookkeeping and payroll services revenue | $219.92 billion | 2025; sum of four Census quarterly estimates | Census / FRED |
| US revenue in the same industry | $125.46 billion | First half of 2026; not a full-year estimate | Census QSS |
| UK turnover across accounting and auditing, bookkeeping, and tax consultancy subclasses | £46.36 billion | 2023; sum of three ONS subclass estimates | ONS |
| US employer establishments in NAICS 5412 | 137,069 | 2023; establishments, not distinct firms | Census profile |
| UK accounting and auditing enterprises | 30,705 | March 2024; VAT and/or PAYE register, SIC 69201 | ONS |
| US accountant and auditor employment | 1,595,200 | 2025 projection base; occupation across industries | BLS projections |
| UK and ROI registered statutory audit firms | 3,421 | End of 2025; regulated subset of service providers | FRC, Figure 21 |
| US undergraduate accounting enrollment | 281,992 | Spring 2026; all undergraduate institution types in the cited release | AICPA / Clearinghouse |
These are separate measures of scale. They should not be added together or used as interchangeable denominators. A multi-office firm can contain several establishments, while an accountant may work inside a business that sells no accounting services to external clients.
What counts as the accounting industry?
For a useful market comparison, define the unit before comparing the number.
| Measure | What is being counted | What a buyer or researcher should establish |
|---|---|---|
| Services revenue or turnover | Sales by businesses within an industry classification | Which services, countries, business types and years are covered? |
| Firm or enterprise count | Businesses within a defined register or population | Are sole practitioners and businesses without employees included? |
| Establishment count | Operating locations within a business population | Can one firm appear at several locations? |
| Occupational employment | Jobs classified by the work performed | Does the occupation span accounting firms, industry and government? |
| Degree completions | Awards completed during an academic year | Are bachelor's and master's awards combined? |
| Student enrollment | Students enrolled during a particular term | Which programs and institution types are included? |
This article treats accounting services separately from accounting software. An accounting firm's turnover, its spending on software and the salaries of its employees can describe overlapping economic activity. Combining them would overstate the addressable market.
US accounting services market size and revenue
The Census revenue series totals $219.92 billion for 2025, compared with $215.03 billion for 2024. The calculated increase is 2.3% in nominal dollars. The Quarterly Services Survey covers employer firms; the selected NAICS 5412 series is for establishments subject to federal income tax. It does not represent every provider without employees. Source data; Census QSS.
| Calendar year | Revenue, USD billions | Calculation |
|---|---|---|
| 2021 | 184.68 | Four quarterly estimates added together |
| 2022 | 198.87 | Four quarterly estimates added together |
| 2023 | 212.57 | Four quarterly estimates added together |
| 2024 | 215.03 | Four quarterly estimates added together |
| 2025 | 219.92 | Four quarterly estimates added together |
Source: US Census Bureau, Quarterly Services Survey, distributed through FRED. Annual totals and growth are Tailride calculations using the September 9, 2026 data vintage. The underlying quarterly series is not seasonally adjusted and is not adjusted for inflation.
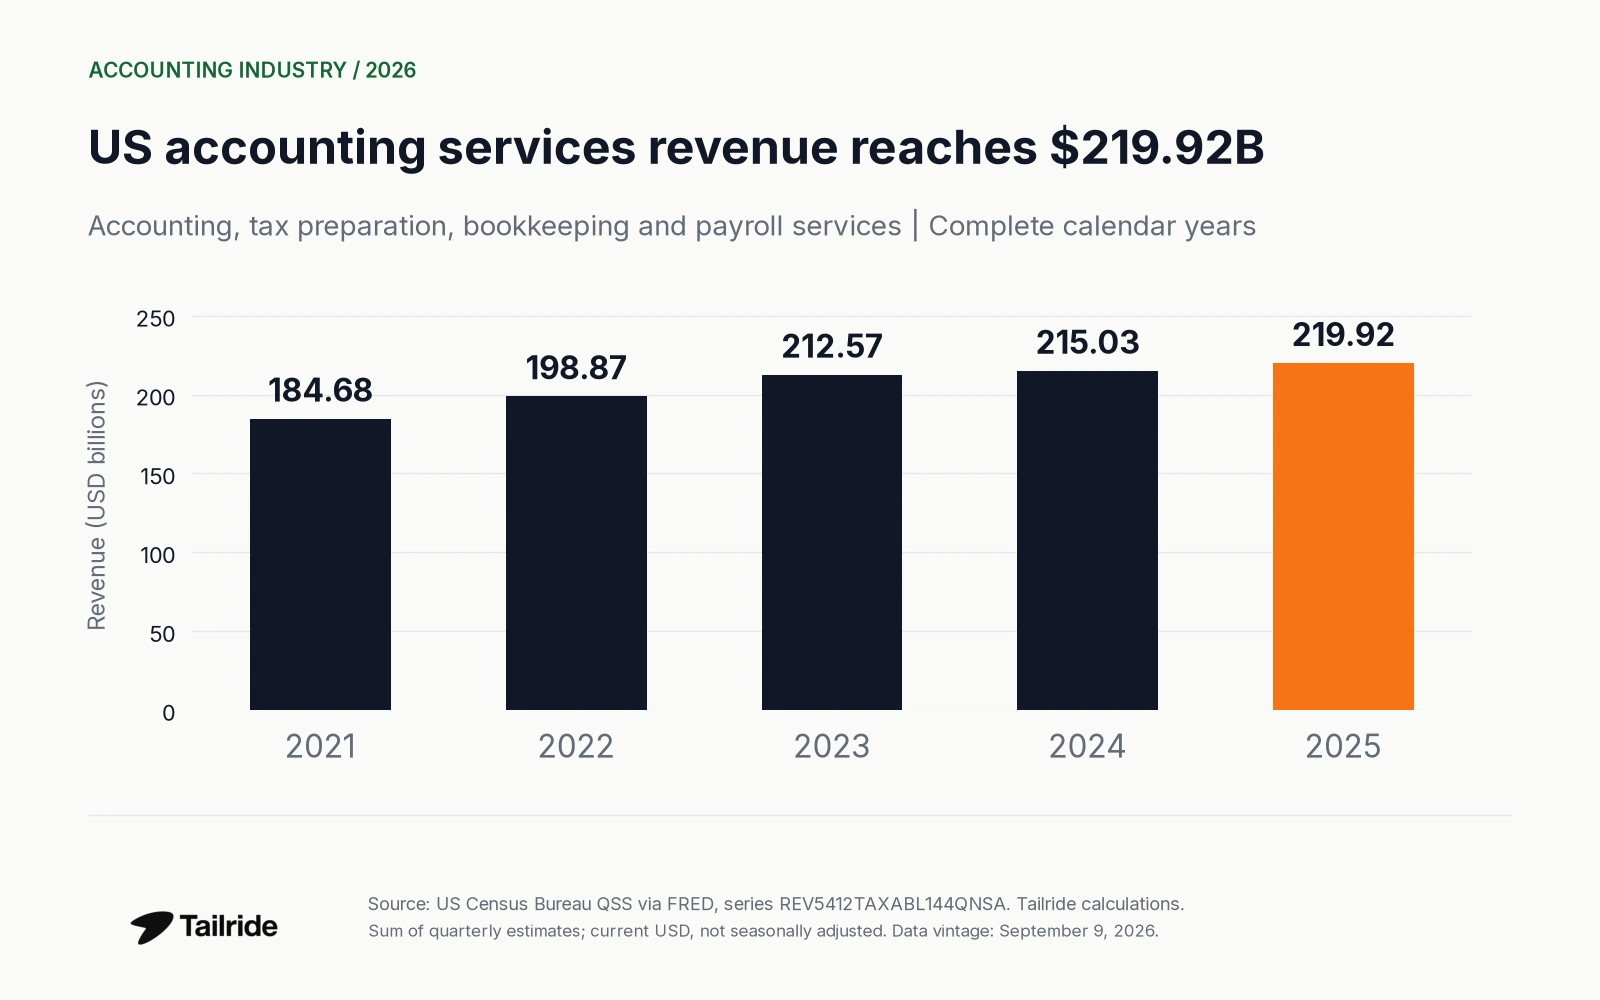
Figure 1. Complete calendar years only. Annual totals sum the quarterly Census estimates; 2026 is excluded from this chart because the year is incomplete.
The newer Census release reports $58.385 billion for Q2 2026, up 5.2% year over year. First-half revenue reached $125.463 billion, up 5.6% against the same period in 2025. These are current-dollar estimates, not measures of real output growth. Census QSS, September 9, 2026, Table 1c, NAICS 5412
The measured industry combines several services. For a bookkeeping business, the relevant market is the portion it can serve with its location, expertise, client mix and delivery model. The total establishes scale; it does not estimate any individual provider's revenue opportunity.
UK accounting services turnover
The three ONS subclasses reviewed here total £46.36 billion in 2023. The calculation combines accounting and auditing, bookkeeping, and tax consultancy from one Annual Business Survey extract. It is a dated services-market benchmark, not a 2026 revenue estimate. ONS FOI-2025-3252
| UK SIC 2007 subclass | Activity | 2023 turnover, GBP billions |
|---|---|---|
| 69201 | Accounting and auditing activities | 30.49 |
| 69202 | Bookkeeping activities | 15.11 |
| 69203 | Tax consultancy | 0.76 |
| Combined | Sum of the three subclasses | 46.36 |
Source: ONS, released November 28, 2025, accompanying workbook, sheet FOI_2025_3252, cells D8–D10. The sum uses unrounded source values before presentation to two decimal places.
The categories classify businesses by their activity. They do not divide every accounting firm's individual service lines. For example, the tax consultancy subclass should not be read as the total value of tax work performed throughout the economy.
The UK and US totals also use different classification systems, currencies, years and statistical programs. They provide country-specific context rather than a directly comparable ranking or a combined global total. Turnover measures sales, not profit or value added.
How many accounting firms are there?
There is no single count that covers every accounting provider across countries. The available sources use different business units and registration rules.
The US Census profile reports 137,069 employer establishments in accounting, tax preparation, bookkeeping and payroll services for 2023. That is a count of establishments with employees, rather than a count of unique accounting firms or all self-employed practitioners. Census NAICS 5412 profile
For the UK, an ONS register extract counts 30,705 VAT and/or PAYE-based enterprises in accounting and auditing activities in March 2024. It covers SIC 69201, excluding businesses classified separately under bookkeeping or tax consultancy. ONS, Analysis 1, cell B18
Registered audit firms form a narrower population. The FRC's latest series covers firms registered to perform statutory audits in the UK and Republic of Ireland:
| Year-end | Registered statutory audit firms |
|---|---|
| 2021 | 4,745 |
| 2022 | 4,310 |
| 2023 | 4,038 |
| 2024 | 3,760 |
| 2025 | 3,421 |
Source: FRC, Key Facts and Trends 2026, Figure 21 data.
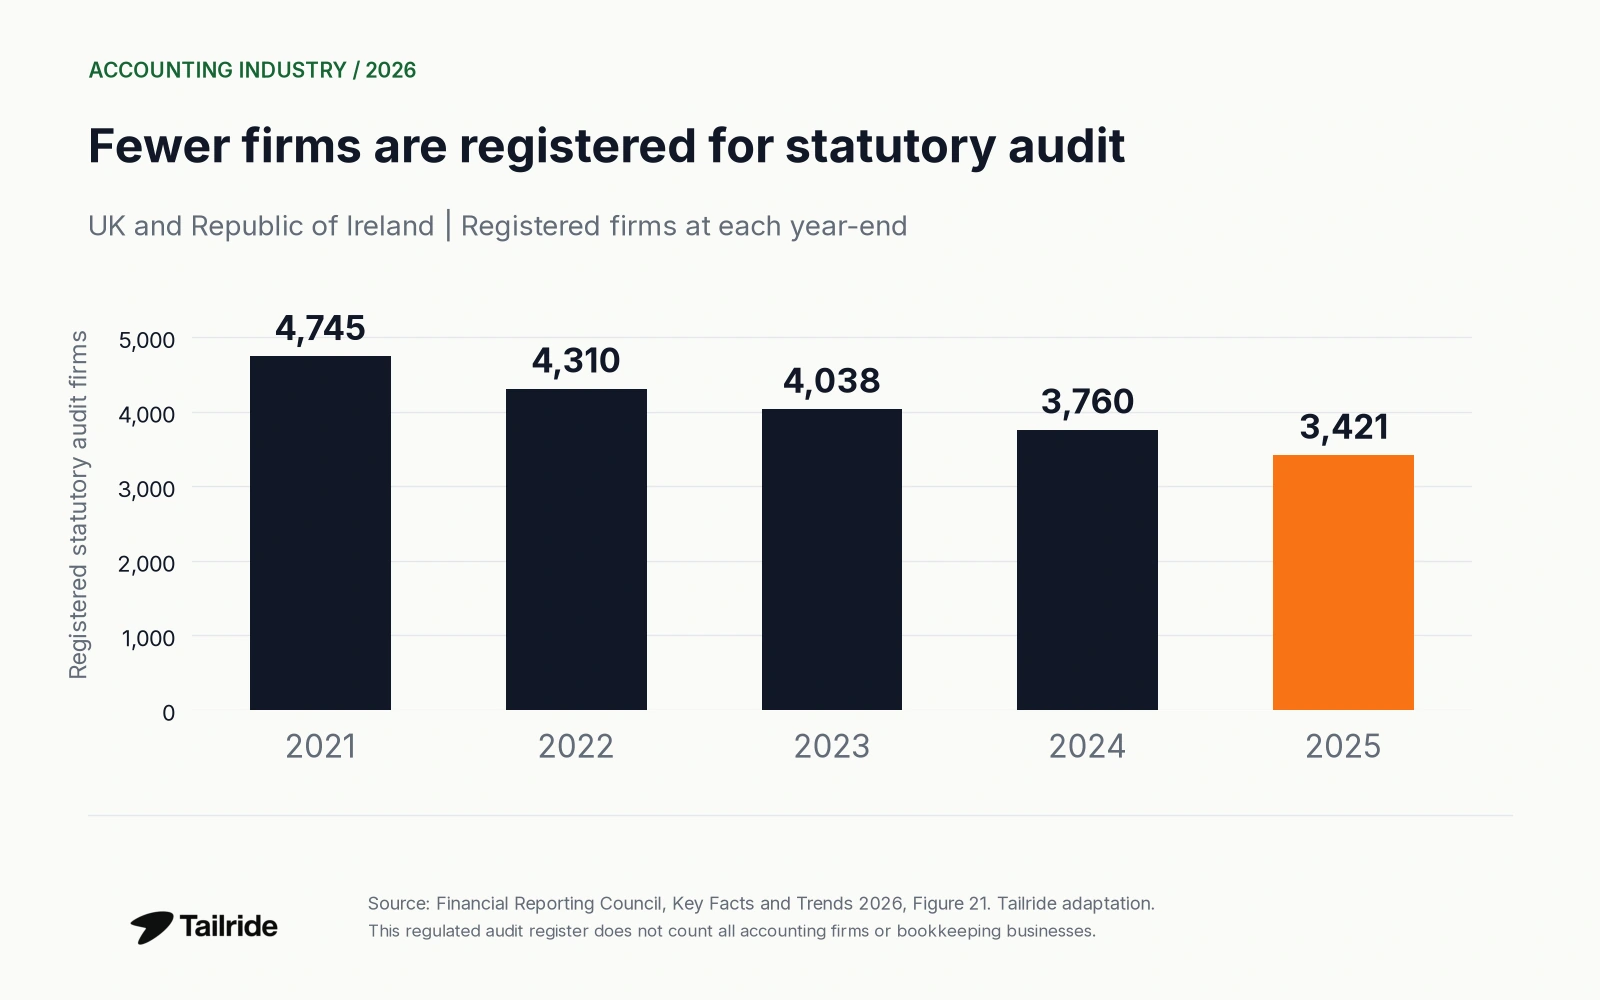
Figure 2. A register of statutory audit firms, rather than a census of all accounting or bookkeeping businesses.
The FRC reports a 9% decline in 2025 and says 82% of registered firms had one to three principals. The number of principals describes ownership or leadership structure, not employee headcount. FRC 2026, paragraphs 58–62
A falling registration count alone cannot establish how much client work disappeared, moved between firms or was affected by consolidation. Use it to describe the regulated audit supplier population, with the geography and registration scope intact.
Accounting employment and job outlook
BLS projects US accountant and auditor employment to grow from 1,595,200 in 2025 to 1,674,600 in 2035, a net increase of 79,400 jobs, or 5% after rounding. BLS occupational projections, SOC 13-2011
The same projections show 115,300 annual openings on average over the decade. Openings include replacement needs, so the figure is not a forecast of that many newly created jobs each year. These occupational estimates span employers across industries; they do not measure accounting-firm staffing alone. BLS
For the broader discussion of how technology may change the profession, see Will AI Replace Accountants?. Here, the employment projection remains a dated labor-market measure rather than a claim about the effect of a particular software product.
Accountant salary statistics
The US median annual wage for accountants and auditors was $83,680 in May 2025. Selected industry medians differed:
| Employing industry | Median annual wage, USD |
|---|---|
| Finance and insurance | 93,290 |
| Management of companies and enterprises | 91,940 |
| Government, excluding state and local education and hospitals | 83,350 |
| Accounting, tax preparation, bookkeeping and payroll services | 81,490 |
Source: BLS Occupational Outlook Handbook, Pay section.
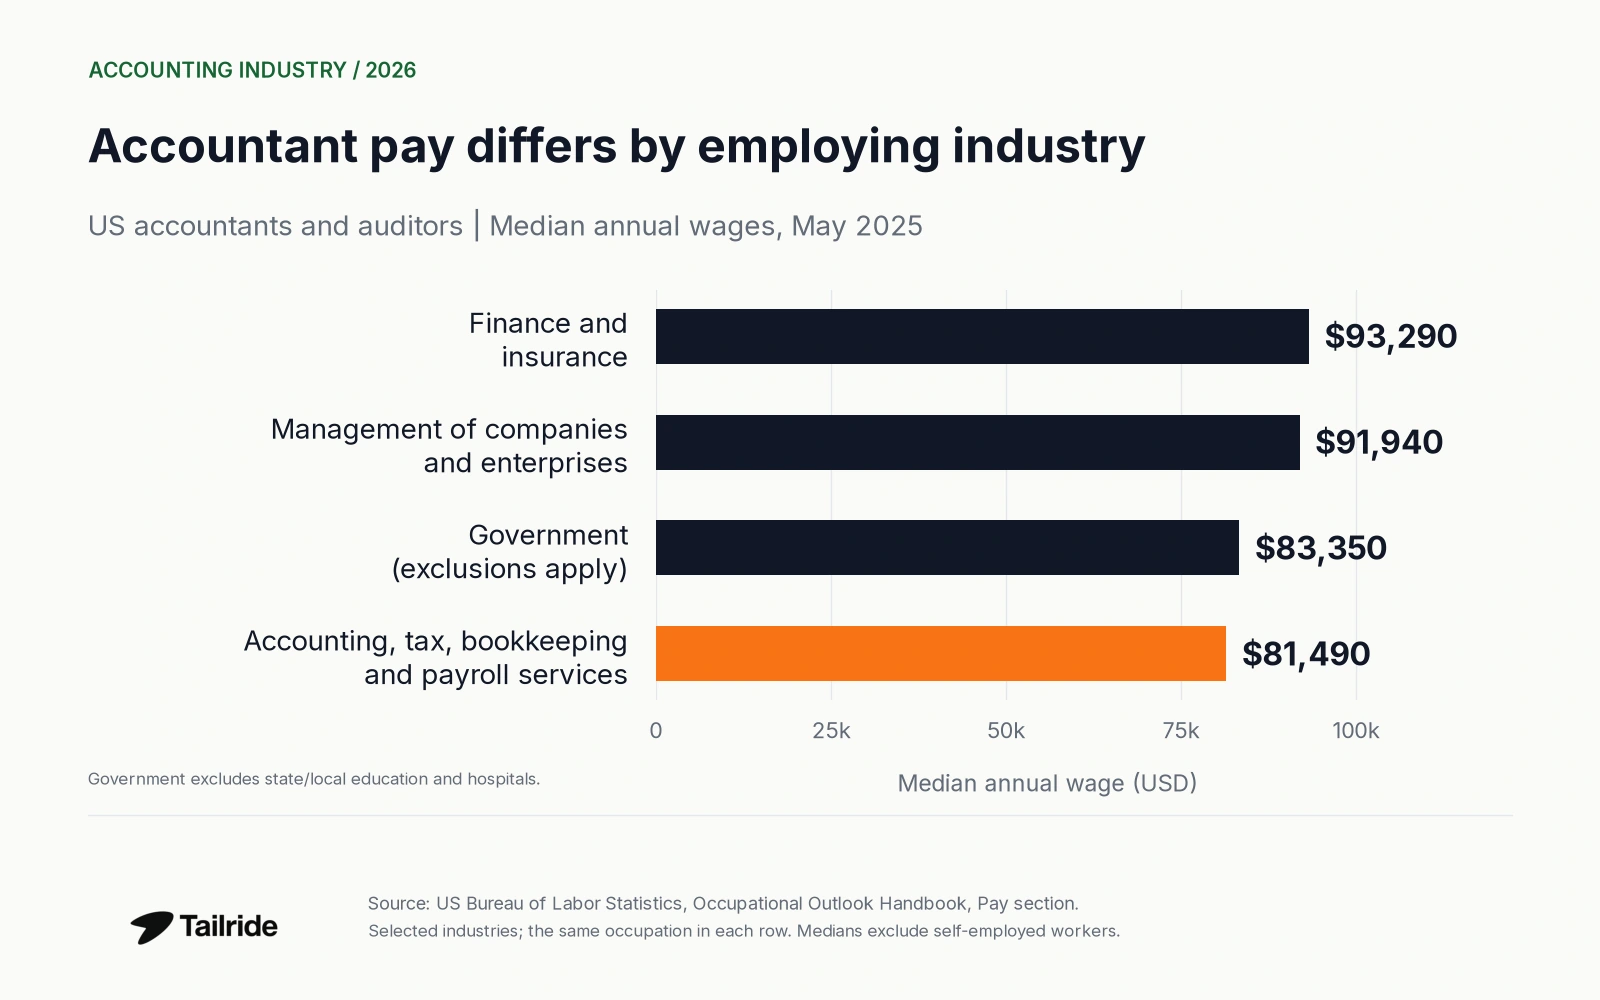
Figure 3. The same occupation across selected employing industries; these are medians, not starting salaries or billing rates.
BLS wage estimates exclude self-employed workers. A wage is also only one component of employment cost. For a firm's staffing plan, benefits, supervision, location and experience can change the budget substantially.
Accounting graduates and student enrollment
The profession's education pipeline contains indicators from different points in time. Fewer completed degrees in one academic year can coexist with more students enrolling later.
AICPA's 2025 Trends report lists 55,152 bachelor's and master's degree completions for 2023–24, down 6.6% from the previous year. The total comprises 40,817 bachelor's and 14,335 master's awards in the report's accounting pipeline coverage; the latter includes accounting or taxation. The latest row in that report is provisional IPEDS data. These are degree awards, not a count of people immediately entering public accounting. AICPA, Figure 1.1, p. 9; accompanying release
The newer enrollment release gives a different signal. US undergraduate accounting enrollment rose from 266,868 in spring 2025 to 281,992 in spring 2026, an increase of 5.7%. Four-year programs enrolled 205,180, up 8.9% year over year. AICPA, June 9, 2026, reporting National Student Clearinghouse data
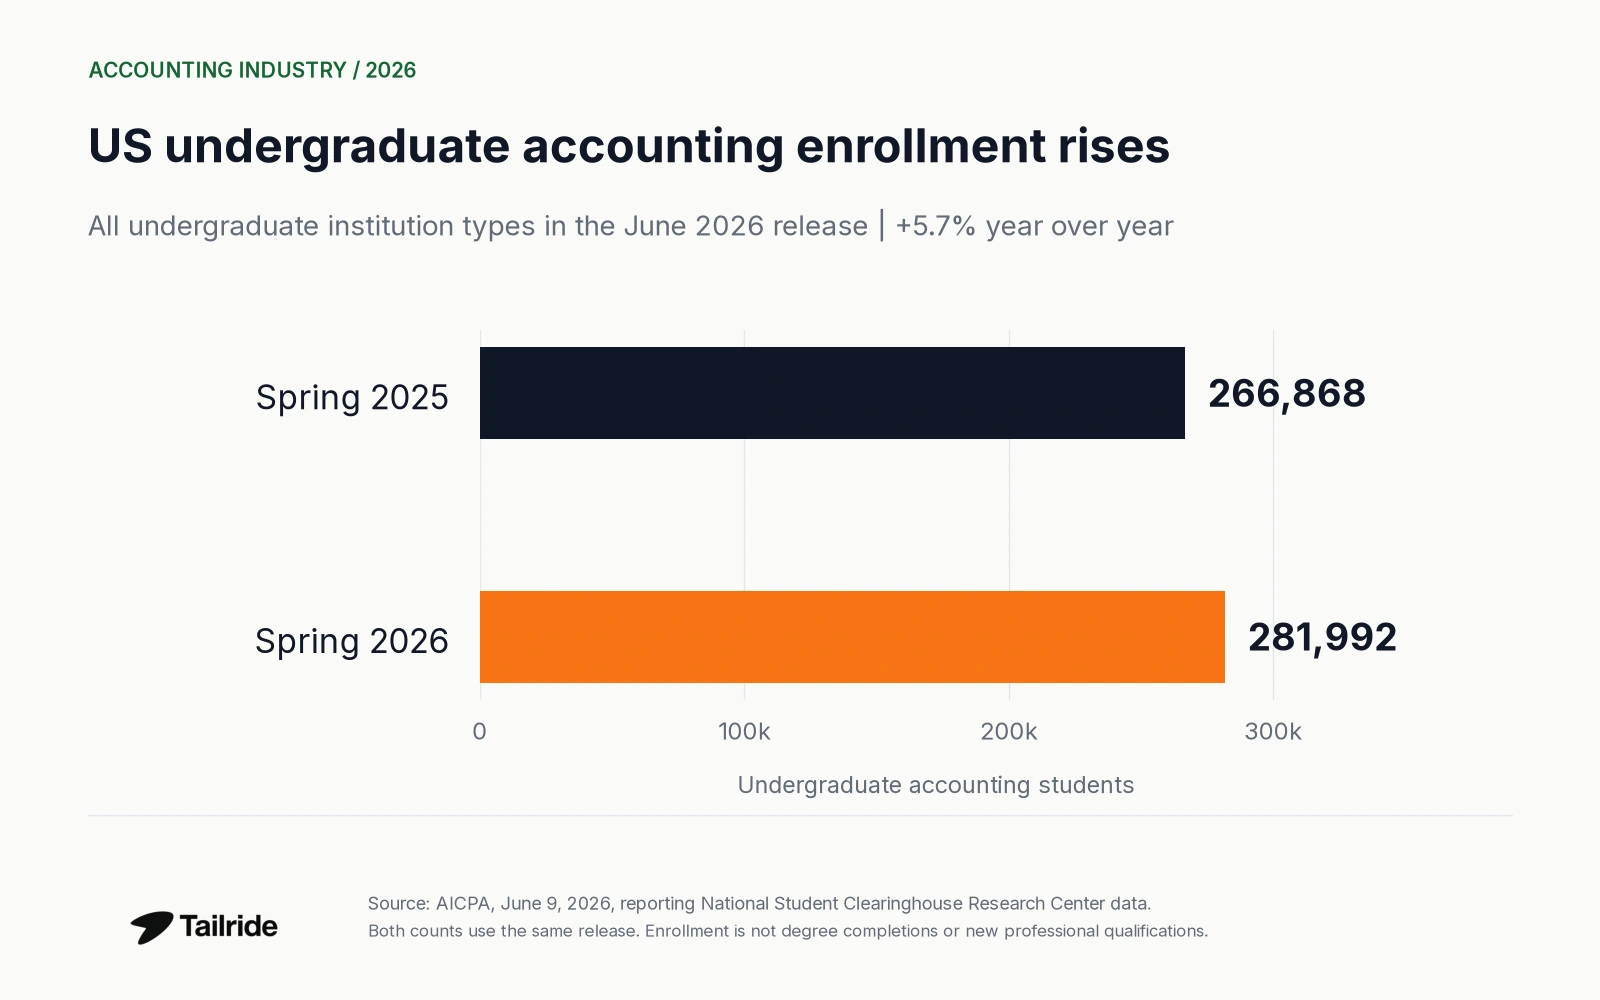
Figure 4. A like-for-like comparison as reported in the June 2026 release, including four-year, community-college and other undergraduate institution types.
The enrollment release does not provide master's enrollment by major. Its totals should not be compared directly with the combined degree-completion total above. Growing enrollment is an encouraging recruitment signal; it does not establish future graduation, qualification or retention rates.
Hiring survey results need another distinction. Firms responding to AICPA's Trends survey reported 11,985 new graduate hires in 2024. AICPA explicitly says the response level did not support a reliable national projection. That respondent total is therefore unsuitable as a US-wide hiring estimate. AICPA Trends, key insights and methodology
What these figures mean for accounting firms
The market data can support a capacity discussion, but a national revenue figure cannot identify an individual firm's bottleneck. Before translating industry growth into a hiring or technology budget, examine where the firm's own working time goes.
Three useful starting questions are:
-
How much time is spent finding and preparing client documents before accounting review begins?
-
Which delays arise from missing information, and which require professional judgment?
-
Can the team handle more client work without increasing rework or weakening review?
Measure the starting position before evaluating any change. Record actual staff time, document volumes, outstanding items and review work, then compare the same measures after implementation.
Tailride for accounting firms addresses document collection and preparation. It collects invoices and receipts from connected inboxes and supported supplier portals. Its invoice workspace keeps originals beside extracted fields for review before export. The industry statistics in this article do not measure Tailride's impact or establish a savings percentage.
For implementation guidance, see invoice management best practices. The market and workforce figures above provide context for that operational work, rather than a substitute for measuring it.
Frequently asked questions
How big is the accounting industry?
For the US Census NAICS 5412 revenue series, four quarterly estimates total $219.92 billion in 2025. This is a US services measure; it is not a global accounting market estimate. Source data
How many accounting firms are there in the US?
The Census profile provides 137,069 employer establishments for 2023. That figure counts locations, not unique firms, and does not cover every solo practitioner without employees. Census
Is accounting employment growing?
The US BLS projection is 5% growth for accountants and auditors between 2025 and 2035. A projected national increase does not determine hiring conditions in a particular specialty or city. BLS
Are more students studying accounting?
AICPA's June 2026 release reports 5.7% growth in total US undergraduate accounting enrollment between spring 2025 and spring 2026. That measures enrollment, rather than degree completions or new professional qualifications. AICPA / Clearinghouse
Methodology and sources
Tailride reviewed the linked public sources on October 21, 2026. This is secondary research, not an original survey. Statistical agencies, regulators and the publishers of the underlying profession reports were prioritized over unsourced statistics roundups.
Calculations. US annual revenue sums four not-seasonally-adjusted quarters from one FRED series, sourced to Census. For 2025, the published values are 63,293 + 55,521 + 51,185 + 49,923 = 219,922 million USD. The 2025 growth calculation uses the unrounded 2024 total of 215,030 million USD. These are derived totals of survey estimates, not separately published annual Census totals.
The UK turnover sum uses 30,494.60512280611 + 15,107.980598863509 + 759.9736313394455 million GBP from one ONS workbook. Rounding is applied after summation. Currencies remain in their original units.
Scope and vintage. The US revenue series, UK turnover subclasses, UK enterprise register, US establishment count and statutory audit register have different coverage. We make no cross-country market-share calculation. Sources may revise estimates; the article preserves the editions reviewed. The detailed UK turnover extract describes 2023 and is not presented as a current-year estimate.
Labor and education. BLS projections are forecasts, and salary medians describe employees. AICPA degree counts, undergraduate enrollment and respondent hiring totals measure separate populations. The article preserves the provisional label on degree completions and the hiring survey's national-estimation limitation.
Sources
-
US Census Bureau QSS, via FRED: NAICS 5412 revenue, series REV5412TAXABL144QNSA - quarterly values, million USD; September 9, 2026 vintage.
-
US Census Bureau: Q2 2026 Quarterly Services Survey release - September 9, 2026; accompanying Table 1c, NAICS 5412.
-
ONS: accounting, auditing, bookkeeping and tax consultancy turnover, 2023 - FOI-2025-3252; accompanying workbook, sheet
FOI_2025_3252, D8–D10. -
US Census Bureau: NAICS 5412 industry profile - 2023 County Business Patterns employer establishments.
-
ONS: accounting and auditing enterprise count and employment, 2019–24 - published March 6, 2025; accompanying workbook, Analysis 1, B18.
-
BLS: occupational projections and worker characteristics - 2025–35, SOC 13-2011; employment and openings in thousands in the source table.
-
FRC: Figure 21 downloadable data - UK and ROI registered audit firms, 2021–25.
-
FRC: Key Facts and Trends in the Accountancy Profession 2026 - published October 5, 2026; paragraphs 58–62.
-
BLS: Accountants and Auditors, Occupational Outlook Handbook - updated August 27, 2026; May 2025 pay.
-
AICPA: US accounting undergraduate enrollment, June 2026 - National Student Clearinghouse figures as reported by AICPA.
-
AICPA: 2025 Trends report release - degree totals and provisional status; Figure 1.1 on p. 9 of the full report was also checked.
-
AICPA: 2025 Trends full report - hiring limitations, key insights and methodology.
-
Tailride Docs: Invoices - product capabilities, checked October 2026.
