
Master Margin Calculations in Excel
Unlock business profitability with our guide to margin calculations in Excel. Learn to calculate gross margin, net margin, and markup with real-world examples.
Figuring out your profit margin in Excel is actually pretty simple. All it takes is the formula = (Selling Price - Cost) / Selling Price to see what percentage of your revenue is pure profit. This quick calculation does more than just crunch numbers; it tells a clear story about your business's financial health, showing you exactly which products are your stars and which are just dragging you down.
Why Margin Calculations Are Your Business's Superpower
Let's be real - terms like 'gross profit margin' and 'net margin' can sound a bit intimidating, like something best left to the finance department. But what if I told you a single percentage in an Excel sheet could reveal the true vitality of your business? This isn't about getting bogged down in complex financial modeling. It's about making smarter, data-backed decisions that actually drive growth.
Whether you're running the whole show, managing a product line, or crafting marketing campaigns, getting a handle on your margins is non-negotiable. It’s the difference between guessing and knowing.
Imagine you run a small online store selling handmade goods. A quick margin calculation could instantly show you that while your popular ceramic mugs sell like hotcakes, their razor-thin margin means your less popular (but high-margin) jewelry line is where the real profit is. That's a game-changer.
Getting Past the Basic Math
This kind of insight is where the magic happens. It helps you answer the tough but essential questions:
-
Can we find a more affordable supplier for our mugs to boost their profitability?
-
Should we put more marketing muscle behind promoting the jewelry?
-
Could we nudge the price of the mugs up a bit without tanking sales?
The core approach to margin calculations in Excel is refreshingly straightforward. The go-to formula has always been (Selling Price - Cost) / Selling Price.
In a spreadsheet, this usually looks something like =(C2-B2)/C2, where cell C2 holds your selling price and B2 holds the cost. This allows any business to see how much of each dollar earned is profit versus how much went into producing the item. For those interested in how this classic formula is evolving, you can explore a detailed guide on its modern applications.
Key Takeaway: Mastering margins isn't just a numbers game. It's about turning that data into smart strategies that directly boost your bottom line and set you up for long-term success.
Key Margin Terms at a Glance
Before we dive deeper, it helps to have a quick reference for the core concepts. Think of this table as your cheat sheet for distinguishing between the different - but equally important - types of margins we'll be covering.
| Term | What It Measures | Simple Formula |
|---|---|---|
| Gross Margin | Profitability of individual products, before overhead. | (Revenue - COGS) / Revenue |
| Net Margin | Overall profitability of the entire business after all expenses. | (Net Income) / Revenue |
| Markup | How much the selling price is increased over the cost. | (Selling Price - Cost) / Cost |
Getting these terms straight is the first step. Now, my goal is to walk you through how to calculate them in a way that feels practical and empowers you to use them with confidence.
Crunching the Numbers: How to Calculate Gross Profit Margin
Alright, let's roll up our sleeves and get this built. The very first thing you need for any real analysis is clean, organized data. To figure out your gross profit margin, you'll start with a simple table in Excel. All it needs are three columns: Product Name, Cost of Goods Sold (COGS), and Selling Price.
Getting this foundation right from the start will save you a world of headaches later. I’ve seen so many people accidentally lump marketing costs or admin salaries into their COGS, but that throws everything off. Remember, COGS only includes the direct costs of making or buying your product - things like raw materials and the labor that directly went into it. Clean data is non-negotiable if you want a true picture of how each product is performing.
The Go-To Gross Margin Formula
Once your product table is set up, it's time to use the formula that does all the heavy lifting. It's surprisingly simple for how much it tells you.
In the first empty cell of a new "Gross Margin" column (we'll assume it's cell D2), you’re going to type this in:
=(C2-B2)/C2
Let’s quickly unpack that:
-
C2 is your Selling Price for the first product.
-
B2 is the COGS for that same product.
-
This little formula first finds the profit (price minus cost) and then divides it by the price to give you the margin as a decimal.
Hit Enter, and then click the "%" button on Excel's Home tab to format the cell as a percentage. Just like that, your decimal becomes a much friendlier number, like 25%.
My Favorite Time-Saving Tip: Don't manually enter this formula for every single product. That's a huge waste of time. Just click the cell with your first formula (D2), grab that little green square in the bottom-right corner - the "fill handle" - and drag it all the way down the column. Excel is smart enough to do the rest for you.
This one move is a massive time-saver, especially if you have a long list of products. As your business grows, finding efficiencies like this becomes absolutely critical. In fact, improving how you handle financial data is a cornerstone of smart business operations, a topic explored further in these invoice management best practices.
With these numbers calculated, your gross profit margins start telling a story. A high margin is a great sign - it means you have healthy profitability on each sale. But a low or negative margin is a major red flag, telling you that a product might be costing you more to sell than it actually brings in.
Finding Your True Profitability with Net Margin

Gross margin is great for seeing if a single product is pulling its weight. But net margin answers the real question on every business owner's mind: is my entire business actually making money? It’s the metric that gives you the full story by factoring in all the other costs that keep the lights on and the business running.
Think about all the expenses that go beyond just making or buying your products. We're talking about rent for your office, employee salaries, the budget for your latest marketing campaign, and even those monthly software subscriptions. These are the operating expenses that gross margin doesn't see, but they are absolutely essential to understanding your company's true financial health.
Summing Your Operating Expenses
The first thing you’ll want to do in your Excel sheet is get a handle on those operating costs. For a small service business looking at its quarterly numbers, your list might look something like this:
-
Salaries: $15,000
-
Rent: $6,000
-
Marketing: $3,000
-
Software & Utilities: $1,500
Adding those up gives you a total of $25,500 in operating expenses for the quarter. A quick SUM function in Excel gets this done in seconds. With that number, you're ready to find out your true profitability.
The formula for net margin is =(Net Income / Revenue) * 100. To get there, you first need to calculate your Net Income, which is simply Revenue - COGS - Operating Expenses.
Let's say your revenue for the quarter was $50,000 and your COGS was $10,000. Your net income would be $50,000 - $10,000 - $25,500 = $14,500. To find the net margin percentage, you just divide that by your revenue: ($14,500 / $50,000), which comes out to 29%.
A quick tip: Excel margin calculations are powerful for steering your business strategy, not just tallying sales. For example, you can calculate your operating profit margin by dividing operating profit by total revenue. A simple formula like
=(B2-B3-B4)/B2, where B2 is revenue and B3 and B4 are different costs, can instantly show you your margin. To get more ideas, you can discover more insights about visualizing this data on Bizinfograph.com.
Keeping a close eye on your net margin is what helps you make smarter decisions about your budget and find places to run more efficiently. Ultimately, a healthy net margin is the clearest sign you've built a sustainable business.
Margin vs. Markup: What's the Real Difference?
It’s one of the most common trip-ups I see in business finance: getting margin and markup mixed up. While they sound similar, they tell you two completely different things about your pricing strategy and, more importantly, your profitability. Messing them up can lead to some seriously flawed business decisions.
Here’s a simple way I like to explain it. Margin looks at your profit as a piece of the selling price. It answers the question, "For every dollar of revenue, how many cents are pure profit?"
Markup, on the other hand, looks at your profit from the perspective of the cost. It answers the question, "How much did I increase the price from what it cost me to get?"
This handy visual breaks down how your sales revenue and the cost of your goods (COGS) come together to determine your gross margin.
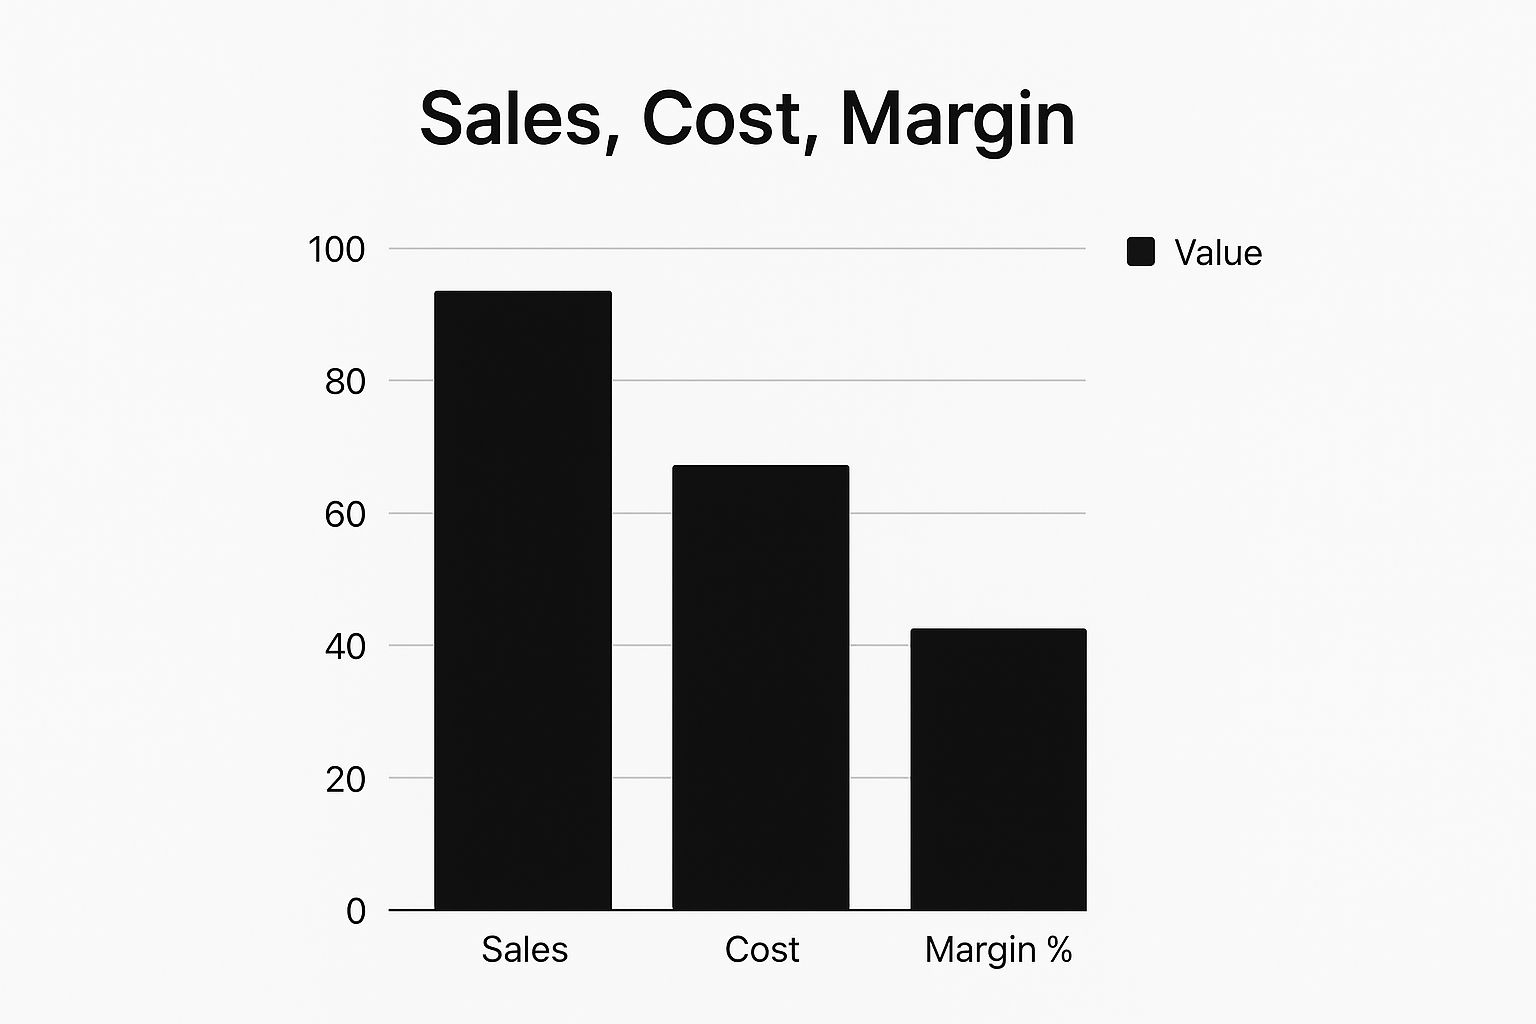
As you can see, the profit margin is what's left after you've paid for the product itself. It’s a direct measure of how well you're turning sales into actual profit.
Breaking Down the Excel Formulas
Let's get practical and put this into an Excel sheet. Imagine you're selling a widget. It costs you $75 to acquire, and you've set the retail price at $100.
Here are the formulas you’d pop into your cells:
-
For Markup:
= (Price - Cost) / Cost -
For Margin:
= (Price - Cost) / Price
Notice the only difference is the last part of the equation - the denominator. One divides by cost, the other by price. This small change makes a huge difference.
Using our example:
-
The markup calculation would be
=(100 - 75) / 75, giving you 33.3%. You've marked up the product by a third of its cost. -
The margin calculation is
=(100 - 75) / 100, which comes out to 25%. This means for every $100 sale, $25 is gross profit.
To make this crystal clear, let's lay it out in a table.
Margin vs Markup: A Direct Comparison
This table uses the same product data to show exactly how these two metrics differ and what they're telling you.
| Metric | Formula in Excel | What It Tells You | Example (Cost $75, Price $100) |
|---|---|---|---|
| Margin | =(Price - Cost) / Price | The percentage of revenue that is profit. | 25% |
| Markup | =(Price - Cost) / Cost | How much the cost was increased to get the price. | 33.3% |
Seeing them side-by-side really highlights their distinct roles.
My Key Takeaway: Think of markup as a pricing tool and margin as a profitability tool. You use markup to decide on a price, but you analyze margin to understand your financial health. They are two sides of the same coin, but they are absolutely not interchangeable.
In day-to-day operations, you'll lean on markup when you're setting your prices to make sure you're covering all your costs and building in a healthy profit from the start. Then, you'll shift your focus to margin to analyze performance, track efficiency, and make smart decisions for the business's future. Both are crucial for effective margin calculations in Excel.
Unlocking Deeper Insights with Excel Tools
Okay, so you've got your basic margin calculations in excel set up. Now, the real fun begins. Your spreadsheet is more than just a list of numbers; it's a dynamic tool ready to tell you the story of your business. With a few smart features, you can make that data talk and turn those raw figures into insights you can actually act on.
The idea is to move beyond just knowing your margins to truly understanding them. We're going to create a visual language in your spreadsheet that instantly flags what’s working and what isn’t. This takes your simple calculation sheet and turns it into a serious tool for strategic analysis.
One of my favorite ways to do this is with Conditional Formatting. This feature is a game-changer. It automatically colors your cells based on the numbers inside them. Imagine looking at your product list and instantly seeing your highest-margin items glowing in green, while your problem products - the ones with razor-thin or negative margins - are flagged in bright red. It's a powerful visual shortcut that draws your attention exactly where it needs to be.
From Data Points to Strategic Trends
Seeing individual product performance is great, but the real power comes from spotting the bigger picture. This is where PivotTables become your absolute best friend. Seriously. A PivotTable can take a massive list of product margins and summarize it in just a few clicks.
It helps you answer the really important questions, like:
-
Which product category is my most profitable?
-
How did our margins change month-over-month last quarter?
-
Are products from a specific supplier consistently bringing in better margins?
You'd never spot these kinds of trends just by scrolling through endless rows of data. Another fantastic technique is to visualize your key metrics. Once your formulas are solid, you can learn to visualize financial data like a pro, creating compelling charts and dashboards that are perfect for sharing with your team.
Margin percentage is the classic measure of profitability, telling you how much profit you make for every dollar of revenue. The Excel formula is simple:
=(E2-D2)/E2, where E2 is your selling price and D2 is your cost. So, if you sell something for $100 with a 25% margin, your cost was $75, and your profit is $25.
Ultimately, these tools help you build a simple but powerful dashboard right inside Excel. A bar chart comparing margins across categories or a line chart tracking net margin over time gives you a quick, at-a-glance health check for your business.
When you get to a point where you want to automate these financial workflows even more, looking into accounting automation software is a great next step. It can seamlessly connect your analysis directly to your day-to-day financial operations.
Got Margin Questions? We've Got Answers
Once you get the hang of the basic formulas, you'll find that real-world business scenarios throw a few curveballs. It’s one thing to calculate margin in a textbook example, but what happens when things get messy? Let's dive into some of the most common questions I hear from business owners trying to get their numbers right.
How Do I Handle Costs That Always Change?
This is a big one. You might buy the same product from a few different suppliers, and the price is never quite the same. So, which cost do you use for your COGS?
The best approach here is to calculate a weighted average cost. This method blends all your different purchase prices together to give you a much more stable and accurate picture of your true costs over time. Relying on a single purchase price - especially an old one - can really skew your margin calculations.
What About Returns and Discounts?
People often wonder if returns and customer discounts should be factored in. The answer is a resounding yes! Your starting point should always be net revenue.
Think of it this way: net revenue is your total sales after you’ve subtracted all those pesky returns and discounts. If you use your gross sales number, you're working with inflated figures, which will make your margins look much better than they actually are. It's a common mistake that can lead to a false sense of security.
What if My Margin is Negative or Zero?
Seeing a negative number can be alarming, but it's telling you something crucial. A negative margin means you’re actively losing money on every single sale of that item. The cost to get it on the shelf is higher than what you're selling it for. This is a five-alarm fire that needs your immediate attention - it’s time to renegotiate with suppliers, raise your price, or consider dropping the product.
And a zero margin? That means you're breaking even. You're not losing money, which is good, but you're not making a single cent of profit to help cover your rent, payroll, and other operating expenses. It's treading water.
Key Takeaway: The details matter. Using a weighted average for costs and always starting with net revenue are non-negotiable for accurate margin analysis. It’s the only way to get a true picture of your profitability.
Getting these cost calculations right has a ripple effect across your business. For example, solid cost data is the first step to improve accounts payable efficiency and make sure your entire financial system is running smoothly.
Tired of manually chasing down invoices and receipts to calculate your costs? Tailride automates the entire process, capturing financial documents from your emails and portals and extracting the data directly into your accounting software. Stop digging for numbers and start making decisions. Discover how Tailride can give you back hours of your week.